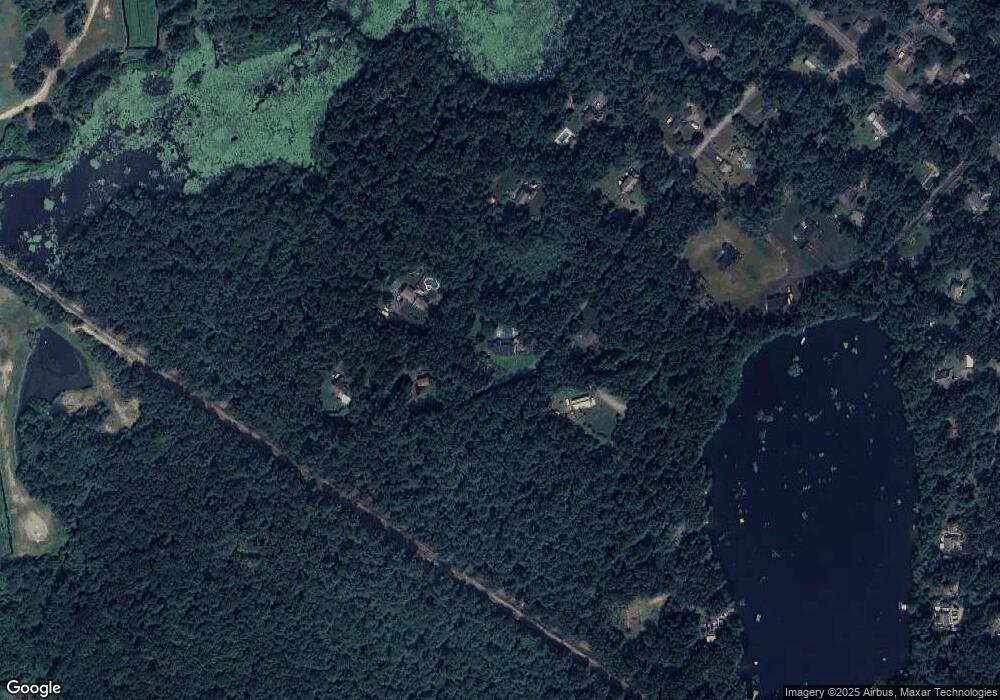
29 Thompson St Pembroke, MA 02359
Estimated Value: $710,000 - $1,064,000
4
Beds
5
Baths
3,624
Sq Ft
$232/Sq Ft
Est. Value
About This Home
This home is located at 29 Thompson St, Pembroke, MA 02359 and is currently estimated at $839,433, approximately $231 per square foot. 29 Thompson St is a home located in Plymouth County with nearby schools including Pembroke High School.
Ownership History
Date
Name
Owned For
Owner Type
Purchase Details
Closed on
Aug 14, 2017
Sold by
Mccourt Gerald J and Mccourt Roberta M
Bought by
Welch Michael J and Welch Meghan S
Current Estimated Value
Home Financials for this Owner
Home Financials are based on the most recent Mortgage that was taken out on this home.
Original Mortgage
$280,000
Outstanding Balance
$233,132
Interest Rate
3.88%
Mortgage Type
New Conventional
Estimated Equity
$606,301
Purchase Details
Closed on
May 9, 1990
Sold by
Bearce Wayne A
Bought by
Mccourt Gerald J
Create a Home Valuation Report for This Property
The Home Valuation Report is an in-depth analysis detailing your home's value as well as a comparison with similar homes in the area
Home Values in the Area
Average Home Value in this Area
Purchase History
| Date | Buyer | Sale Price | Title Company |
|---|---|---|---|
| Welch Michael J | $350,000 | -- | |
| Mccourt Gerald J | $274,000 | -- |
Source: Public Records
Mortgage History
| Date | Status | Borrower | Loan Amount |
|---|---|---|---|
| Open | Welch Michael J | $280,000 | |
| Previous Owner | Mccourt Gerald J | $130,000 | |
| Previous Owner | Mccourt Gerald J | $115,000 |
Source: Public Records
Tax History Compared to Growth
Tax History
| Year | Tax Paid | Tax Assessment Tax Assessment Total Assessment is a certain percentage of the fair market value that is determined by local assessors to be the total taxable value of land and additions on the property. | Land | Improvement |
|---|---|---|---|---|
| 2025 | $8,660 | $720,500 | $281,000 | $439,500 |
| 2024 | $8,549 | $710,600 | $276,200 | $434,400 |
| 2023 | $8,488 | $667,300 | $276,200 | $391,100 |
| 2022 | $8,121 | $573,900 | $226,000 | $347,900 |
| 2021 | $7,860 | $539,100 | $215,600 | $323,500 |
| 2020 | $7,484 | $516,500 | $206,000 | $310,500 |
| 2019 | $7,231 | $495,300 | $200,700 | $294,600 |
| 2018 | $7,012 | $470,900 | $185,900 | $285,000 |
| 2017 | $6,988 | $462,800 | $175,900 | $286,900 |
| 2016 | $6,933 | $454,300 | $165,900 | $288,400 |
| 2015 | $6,867 | $465,900 | $175,900 | $290,000 |
Source: Public Records
Map
Nearby Homes