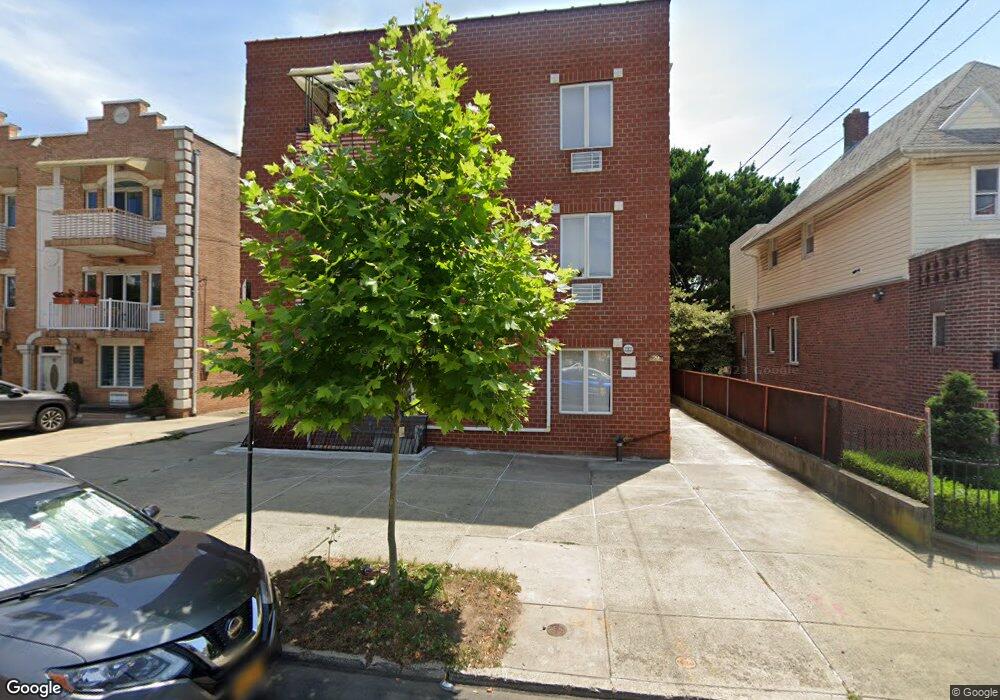
29 Van Sicklen St Unit 1A Brooklyn, NY 11223
Gravesend NeighborhoodEstimated Value: $922,000 - $1,251,466
Studio
--
Bath
1,932
Sq Ft
$578/Sq Ft
Est. Value
About This Home
This home is located at 29 Van Sicklen St Unit 1A, Brooklyn, NY 11223 and is currently estimated at $1,117,117, approximately $578 per square foot. 29 Van Sicklen St Unit 1A is a home located in Kings County with nearby schools including P.S. 215 Morris H Weiss, Is 228 David A Boody, and Coney Island Preparatory Public Charter School.
Ownership History
Date
Name
Owned For
Owner Type
Purchase Details
Closed on
Oct 5, 2017
Sold by
Goynatskiy Borislav and Goynatskiy Elena
Bought by
Pang Ben Hai and Pang Billy
Current Estimated Value
Home Financials for this Owner
Home Financials are based on the most recent Mortgage that was taken out on this home.
Original Mortgage
$580,000
Outstanding Balance
$484,982
Interest Rate
3.86%
Mortgage Type
Purchase Money Mortgage
Estimated Equity
$632,135
Purchase Details
Closed on
Dec 9, 2010
Sold by
Goynatsky Borislav and Goynatsky Elena
Bought by
Goynatskiy Borislav and Goynatsky Elena
Home Financials for this Owner
Home Financials are based on the most recent Mortgage that was taken out on this home.
Original Mortgage
$77,921
Interest Rate
4.17%
Mortgage Type
Purchase Money Mortgage
Purchase Details
Closed on
Jan 7, 2002
Sold by
Vered International Llc
Bought by
Goynatsky Borislav and Goynatsky Elena
Home Financials for this Owner
Home Financials are based on the most recent Mortgage that was taken out on this home.
Original Mortgage
$337,250
Interest Rate
7.04%
Create a Home Valuation Report for This Property
The Home Valuation Report is an in-depth analysis detailing your home's value as well as a comparison with similar homes in the area
Home Values in the Area
Average Home Value in this Area
Purchase History
| Date | Buyer | Sale Price | Title Company |
|---|---|---|---|
| Pang Ben Hai | $790,000 | -- | |
| Goynatskiy Borislav | -- | -- | |
| Goynatsky Borislav | -- | -- |
Source: Public Records
Mortgage History
| Date | Status | Borrower | Loan Amount |
|---|---|---|---|
| Open | Pang Ben Hai | $580,000 | |
| Previous Owner | Goynatskiy Borislav | $77,921 | |
| Previous Owner | Goynatsky Borislav | $337,250 |
Source: Public Records
Tax History
| Year | Tax Paid | Tax Assessment Tax Assessment Total Assessment is a certain percentage of the fair market value that is determined by local assessors to be the total taxable value of land and additions on the property. | Land | Improvement |
|---|---|---|---|---|
| 2025 | $4,896 | $86,104 | $2,710 | $83,394 |
| 2024 | $4,896 | $68,013 | $2,710 | $65,303 |
| 2023 | $4,951 | $60,113 | $2,710 | $57,403 |
| 2022 | $4,829 | $55,423 | $2,710 | $52,713 |
| 2021 | $4,803 | $49,992 | $2,710 | $47,282 |
| 2020 | $2,253 | $42,578 | $2,710 | $39,868 |
| 2019 | $4,249 | $42,578 | $2,710 | $39,868 |
| 2018 | $4,141 | $20,313 | $1,553 | $18,760 |
| 2017 | $3,412 | $20,160 | $1,663 | $18,497 |
| 2016 | $2,525 | $19,019 | $2,118 | $16,901 |
| 2015 | $205 | $17,943 | $2,394 | $15,549 |
| 2014 | $205 | $16,928 | $2,711 | $14,217 |
Source: Public Records
Map
Nearby Homes
- 15 Van Sicklen St
- 33 Kings Place
- 393 Avenue S Unit 6G
- 393 Avenue S Unit 5D
- 393 Avenue S Unit 3G
- 393 Avenue S Unit 3H
- 367 Avenue S Unit 4A
- 367 Avenue S Unit 4F
- 367 Avenue S Unit 2E
- 1889 W 4th St
- 394 Avenue S Unit 3D
- 394 Avenue S Unit 4A
- 388 Avenue S Unit 4F
- 388 Avenue S Unit 1A
- 1899 E 3rd St
- 1684 W 2nd St
- 332 Kings Hwy
- 1858 W 5th St
- 204 Highlawn Ave
- 1815 E 3rd St
- 29 Van Sicklen St Unit 3B
- 29 Van Sicklen St Unit 3A
- 29 Van Sicklen St Unit 2B
- 29 Van Sicklen St Unit 2A
- 29 Van Sicklen St Unit 1B
- 29 Van Sicklen St
- 29 Van Sicklen St Unit 1B
- 29 Van Sicklen St
- 17 Van Sicklen St Unit 6
- 17 Van Sicklen St Unit 4
- 17 Van Sicklen St Unit 2
- 17 Van Sicklen St Unit 5
- 17 Van Sicklen St Unit 3
- 17 Van Sicklen St Unit 1
- 17 Van Sicklen St
- 33 Van Sicklen St
- 30 Lake St
- 26 Lake St
- 39 Van Sicklen St
- 32 Lake St
Your Personal Tour Guide
Ask me questions while you tour the home.