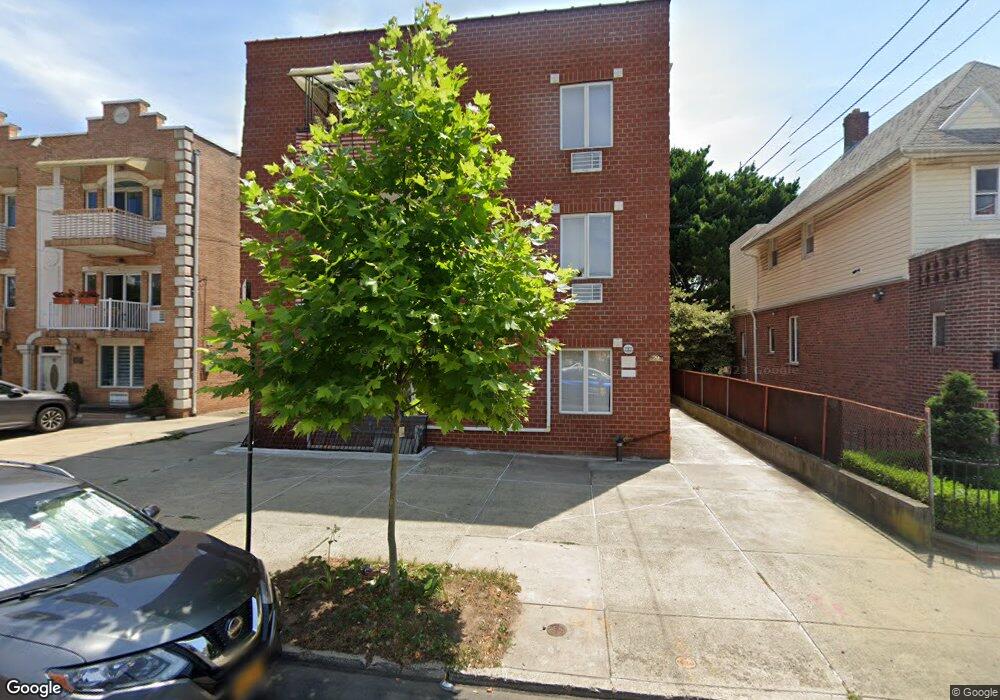
29 Van Sicklen St Unit 1B Brooklyn, NY 11223
Gravesend NeighborhoodEstimated Value: $735,000 - $1,129,000
3
Beds
3
Baths
1,932
Sq Ft
$523/Sq Ft
Est. Value
About This Home
This home is located at 29 Van Sicklen St Unit 1B, Brooklyn, NY 11223 and is currently estimated at $1,010,868, approximately $523 per square foot. 29 Van Sicklen St Unit 1B is a home located in Kings County with nearby schools including P.S. 215 Morris H Weiss, Is 228 David A Boody, and Coney Island Preparatory Public Charter School.
Ownership History
Date
Name
Owned For
Owner Type
Purchase Details
Closed on
Sep 21, 2020
Sold by
Nabar Alaknanda and Nabar Bella
Bought by
Chiu Wai Chun Linda and Wang Ching Moon
Current Estimated Value
Home Financials for this Owner
Home Financials are based on the most recent Mortgage that was taken out on this home.
Original Mortgage
$499,900
Outstanding Balance
$443,628
Interest Rate
2.9%
Mortgage Type
New Conventional
Estimated Equity
$567,240
Purchase Details
Closed on
Jul 10, 2007
Sold by
Ganzman Valery and Nabar Bella
Bought by
Nabar Alaknanda and Nabar Bella
Purchase Details
Closed on
Dec 6, 2001
Sold by
Vered International Llc
Bought by
Ganzman Valery and Nabar Bella
Home Financials for this Owner
Home Financials are based on the most recent Mortgage that was taken out on this home.
Original Mortgage
$319,000
Interest Rate
6.67%
Create a Home Valuation Report for This Property
The Home Valuation Report is an in-depth analysis detailing your home's value as well as a comparison with similar homes in the area
Home Values in the Area
Average Home Value in this Area
Purchase History
| Date | Buyer | Sale Price | Title Company |
|---|---|---|---|
| Chiu Wai Chun Linda | $800,000 | -- | |
| Nabar Alaknanda | -- | -- | |
| Nabar Alaknanda | -- | -- | |
| Ganzman Valery | -- | -- | |
| Ganzman Valery | -- | -- |
Source: Public Records
Mortgage History
| Date | Status | Borrower | Loan Amount |
|---|---|---|---|
| Open | Chiu Wai Chun Linda | $499,900 | |
| Previous Owner | Ganzman Valery | $319,000 | |
| Closed | Nabar Alaknanda | $0 |
Source: Public Records
Tax History Compared to Growth
Tax History
| Year | Tax Paid | Tax Assessment Tax Assessment Total Assessment is a certain percentage of the fair market value that is determined by local assessors to be the total taxable value of land and additions on the property. | Land | Improvement |
|---|---|---|---|---|
| 2025 | $4,896 | $86,104 | $2,710 | $83,394 |
| 2024 | $4,896 | $68,013 | $2,710 | $65,303 |
| 2023 | $4,951 | $60,113 | $2,710 | $57,403 |
| 2022 | $4,829 | $55,423 | $2,710 | $52,713 |
| 2021 | $4,803 | $49,992 | $2,710 | $47,282 |
| 2020 | $2,105 | $42,578 | $2,710 | $39,868 |
| 2019 | $3,956 | $42,578 | $2,710 | $39,868 |
| 2018 | $3,843 | $20,313 | $1,553 | $18,760 |
| 2017 | $3,412 | $20,160 | $1,663 | $18,497 |
| 2016 | $2,525 | $19,019 | $2,118 | $16,901 |
| 2015 | $308 | $17,943 | $2,394 | $15,549 |
| 2014 | $308 | $16,928 | $2,711 | $14,217 |
Source: Public Records
Map
Nearby Homes
- 412 Kings Hwy Unit 6C
- 431 Kings Hwy
- 83 Van Sicklen St
- 379 Kings Hwy Unit 2A
- 393 Avenue S Unit 1G
- 393 Avenue S Unit 4H
- 393 Avenue S Unit 3G
- 387 Ave S Unit 4E
- 367 Avenue S Unit 4A
- 367 Avenue S Unit 1E
- 1853 W 4th St
- 1728 W 2nd St
- 1902 E 1st St
- 387 Avenue S Unit 4E
- 1844 W 4th St
- 355 Kings Hwy Unit 5C
- 394 Avenue S Unit 2E
- 388 Avenue S Unit 1A
- 388 Avenue S Unit 2C
- 388 Avenue S Unit 1B
- 29 Van Sicklen St Unit 3B
- 29 Van Sicklen St Unit 3A
- 29 Van Sicklen St Unit 2B
- 29 Van Sicklen St Unit 2A
- 29 Van Sicklen St Unit 1B
- 29 Van Sicklen St Unit 1A
- 29 Van Sicklen St
- 29 Van Sicklen St
- 17 Van Sicklen St Unit 6
- 17 Van Sicklen St Unit 4
- 17 Van Sicklen St Unit 2
- 17 Van Sicklen St Unit 5
- 17 Van Sicklen St Unit 3
- 17 Van Sicklen St Unit 1
- 17 Van Sicklen St
- 33 Van Sicklen St
- 30 Lake St
- 26 Lake St
- 39 Van Sicklen St
- 15 Van Sicklen St