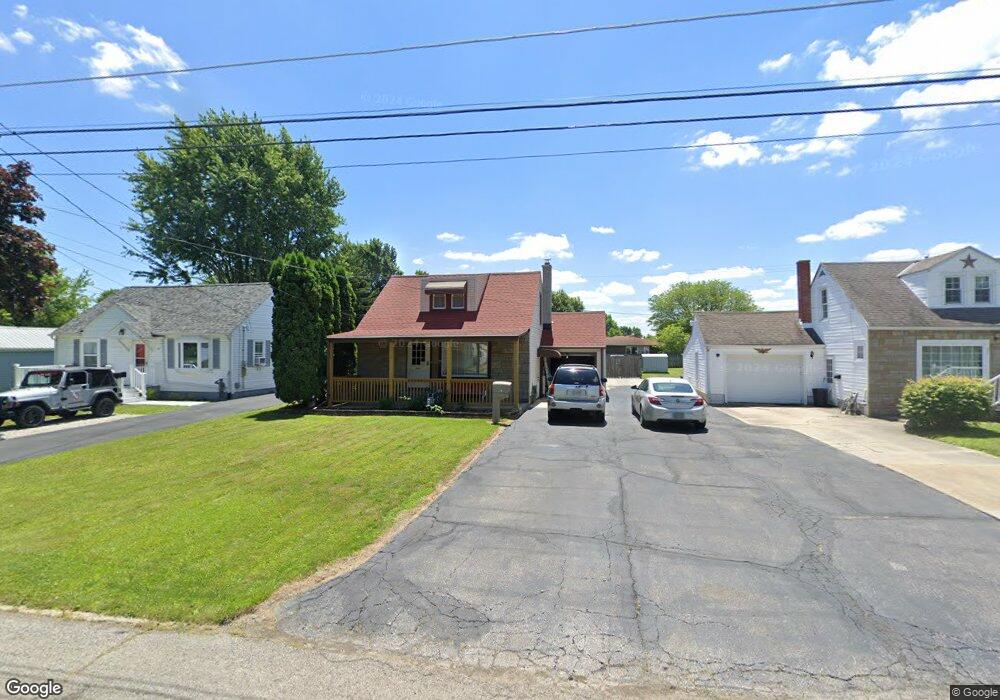
29 W End Blvd Shelby, OH 44875
Estimated Value: $145,000 - $178,000
3
Beds
1
Bath
1,598
Sq Ft
$100/Sq Ft
Est. Value
About This Home
This home is located at 29 W End Blvd, Shelby, OH 44875 and is currently estimated at $159,455, approximately $99 per square foot. 29 W End Blvd is a home located in Richland County with nearby schools including St. Mary's School.
Ownership History
Date
Name
Owned For
Owner Type
Purchase Details
Closed on
Apr 11, 2023
Sold by
Hall Jessie P
Bought by
Frost Michael J
Current Estimated Value
Home Financials for this Owner
Home Financials are based on the most recent Mortgage that was taken out on this home.
Original Mortgage
$48,000
Outstanding Balance
$44,932
Interest Rate
6.49%
Mortgage Type
New Conventional
Estimated Equity
$114,523
Purchase Details
Closed on
Aug 1, 1997
Sold by
Zehner Jason S
Bought by
Hall Jessie P
Home Financials for this Owner
Home Financials are based on the most recent Mortgage that was taken out on this home.
Original Mortgage
$54,971
Interest Rate
7.71%
Mortgage Type
FHA
Purchase Details
Closed on
Oct 24, 1994
Sold by
Deaner David E
Bought by
Zehner Jason S
Home Financials for this Owner
Home Financials are based on the most recent Mortgage that was taken out on this home.
Original Mortgage
$45,600
Interest Rate
8.53%
Mortgage Type
New Conventional
Create a Home Valuation Report for This Property
The Home Valuation Report is an in-depth analysis detailing your home's value as well as a comparison with similar homes in the area
Home Values in the Area
Average Home Value in this Area
Purchase History
| Date | Buyer | Sale Price | Title Company |
|---|---|---|---|
| Frost Michael J | $60,000 | Southern Title | |
| Hall Jessie P | $55,000 | -- | |
| Zehner Jason S | $48,000 | -- |
Source: Public Records
Mortgage History
| Date | Status | Borrower | Loan Amount |
|---|---|---|---|
| Open | Frost Michael J | $48,000 | |
| Previous Owner | Hall Jessie P | $54,971 | |
| Previous Owner | Zehner Jason S | $45,600 |
Source: Public Records
Tax History Compared to Growth
Tax History
| Year | Tax Paid | Tax Assessment Tax Assessment Total Assessment is a certain percentage of the fair market value that is determined by local assessors to be the total taxable value of land and additions on the property. | Land | Improvement |
|---|---|---|---|---|
| 2024 | $1,349 | $35,260 | $4,540 | $30,720 |
| 2023 | $1,349 | $35,260 | $4,540 | $30,720 |
| 2022 | $1,300 | $30,390 | $4,590 | $25,800 |
| 2021 | $1,301 | $30,390 | $4,590 | $25,800 |
| 2020 | $1,302 | $30,390 | $4,590 | $25,800 |
| 2019 | $1,215 | $26,020 | $3,890 | $22,130 |
| 2018 | $1,203 | $26,020 | $3,890 | $22,130 |
| 2017 | $1,216 | $26,020 | $3,890 | $22,130 |
| 2016 | $1,240 | $27,230 | $3,700 | $23,530 |
| 2015 | $1,233 | $27,230 | $3,700 | $23,530 |
| 2014 | $1,191 | $27,230 | $3,700 | $23,530 |
| 2012 | $586 | $27,220 | $3,890 | $23,330 |
Source: Public Records
Map
Nearby Homes