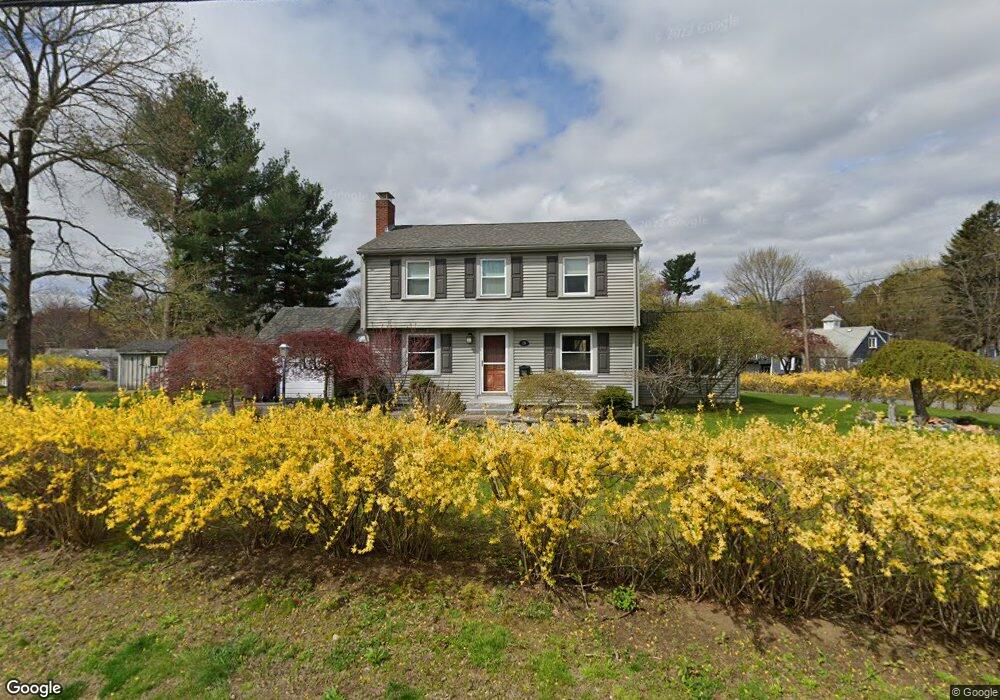
29 Wesley Rd Framingham, MA 01701
Nobscot NeighborhoodEstimated Value: $594,000 - $706,000
4
Beds
2
Baths
1,735
Sq Ft
$376/Sq Ft
Est. Value
About This Home
This home is located at 29 Wesley Rd, Framingham, MA 01701 and is currently estimated at $652,254, approximately $375 per square foot. 29 Wesley Rd is a home located in Middlesex County with nearby schools including Framingham High School, MetroWest Jewish Day School, and Summit Montessori School.
Ownership History
Date
Name
Owned For
Owner Type
Purchase Details
Closed on
Aug 9, 1994
Sold by
Fishman Kenneth S and Fishman Wendell Lisa
Bought by
Scollard Daniel J and Scollard Yun Sook
Current Estimated Value
Home Financials for this Owner
Home Financials are based on the most recent Mortgage that was taken out on this home.
Original Mortgage
$156,600
Interest Rate
8.4%
Mortgage Type
Purchase Money Mortgage
Purchase Details
Closed on
Jun 30, 1988
Sold by
Pruszinski Glenn
Bought by
Fishman Kenneth
Home Financials for this Owner
Home Financials are based on the most recent Mortgage that was taken out on this home.
Original Mortgage
$154,800
Interest Rate
10.47%
Mortgage Type
Purchase Money Mortgage
Create a Home Valuation Report for This Property
The Home Valuation Report is an in-depth analysis detailing your home's value as well as a comparison with similar homes in the area
Home Values in the Area
Average Home Value in this Area
Purchase History
| Date | Buyer | Sale Price | Title Company |
|---|---|---|---|
| Scollard Daniel J | $174,000 | -- | |
| Scollard Daniel J | $174,000 | -- | |
| Fishman Kenneth | $193,500 | -- |
Source: Public Records
Mortgage History
| Date | Status | Borrower | Loan Amount |
|---|---|---|---|
| Open | Fishman Kenneth | $162,500 | |
| Closed | Fishman Kenneth | $152,250 | |
| Closed | Scollard Daniel J | $156,600 | |
| Previous Owner | Fishman Kenneth | $154,800 |
Source: Public Records
Tax History
| Year | Tax Paid | Tax Assessment Tax Assessment Total Assessment is a certain percentage of the fair market value that is determined by local assessors to be the total taxable value of land and additions on the property. | Land | Improvement |
|---|---|---|---|---|
| 2025 | $6,674 | $559,000 | $263,500 | $295,500 |
| 2024 | $6,655 | $534,100 | $235,300 | $298,800 |
| 2023 | $6,281 | $479,800 | $210,000 | $269,800 |
| 2022 | $5,945 | $432,700 | $190,600 | $242,100 |
| 2021 | $5,787 | $411,900 | $183,200 | $228,700 |
| 2020 | $5,838 | $389,700 | $166,500 | $223,200 |
| 2019 | $5,760 | $374,500 | $166,500 | $208,000 |
| 2018 | $5,653 | $346,400 | $160,300 | $186,100 |
| 2017 | $5,464 | $327,000 | $155,600 | $171,400 |
| 2016 | $5,310 | $305,500 | $155,600 | $149,900 |
| 2015 | $5,198 | $291,700 | $155,700 | $136,000 |
Source: Public Records
Map
Nearby Homes
Your Personal Tour Guide
Ask me questions while you tour the home.