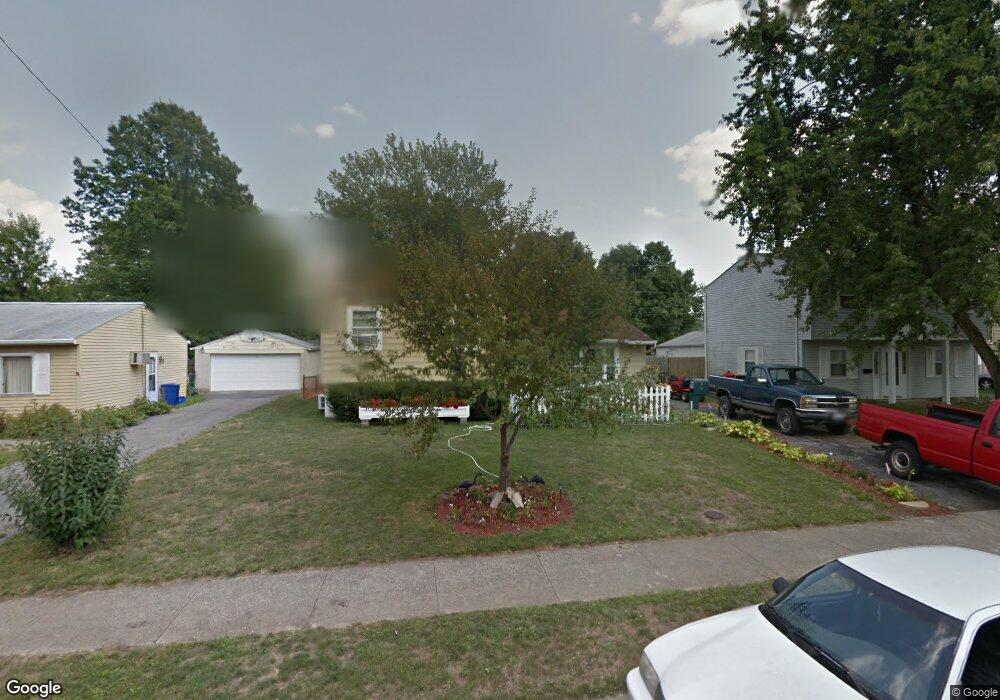
29 Westland Way Delaware, OH 43015
Estimated Value: $241,156 - $275,000
3
Beds
1
Bath
1,318
Sq Ft
$195/Sq Ft
Est. Value
About This Home
This home is located at 29 Westland Way, Delaware, OH 43015 and is currently estimated at $256,539, approximately $194 per square foot. 29 Westland Way is a home located in Delaware County with nearby schools including Robert F. Schultz Elementary School, John C. Dempsey Middle School, and Rutherford B. Hayes High School.
Ownership History
Date
Name
Owned For
Owner Type
Purchase Details
Closed on
Sep 9, 2015
Sold by
Fidelity Federal Savings And Loan Assn O
Bought by
Lash Rodney W and Wasson Matthew F
Current Estimated Value
Home Financials for this Owner
Home Financials are based on the most recent Mortgage that was taken out on this home.
Original Mortgage
$40,000
Outstanding Balance
$15,484
Interest Rate
3.16%
Mortgage Type
New Conventional
Estimated Equity
$241,055
Purchase Details
Closed on
Mar 16, 2010
Sold by
Cds Investments Llc
Bought by
Fidelity Federal Savings & Loan Associat
Purchase Details
Closed on
Feb 28, 2007
Sold by
Cds Investments Llc
Bought by
Diverse Holdings Llc
Purchase Details
Closed on
Jul 10, 1998
Sold by
Keckstein James L
Bought by
Stover Carl L and Stover Darlene M
Home Financials for this Owner
Home Financials are based on the most recent Mortgage that was taken out on this home.
Original Mortgage
$60,000
Interest Rate
7.17%
Mortgage Type
New Conventional
Create a Home Valuation Report for This Property
The Home Valuation Report is an in-depth analysis detailing your home's value as well as a comparison with similar homes in the area
Home Values in the Area
Average Home Value in this Area
Purchase History
| Date | Buyer | Sale Price | Title Company |
|---|---|---|---|
| Lash Rodney W | $71,000 | Title First Box | |
| Fidelity Federal Savings & Loan Associat | $58,000 | Attorney | |
| Diverse Holdings Llc | $1,337,700 | Attorney | |
| Stover Carl L | $82,000 | -- |
Source: Public Records
Mortgage History
| Date | Status | Borrower | Loan Amount |
|---|---|---|---|
| Open | Lash Rodney W | $40,000 | |
| Previous Owner | Stover Carl L | $60,000 |
Source: Public Records
Tax History Compared to Growth
Tax History
| Year | Tax Paid | Tax Assessment Tax Assessment Total Assessment is a certain percentage of the fair market value that is determined by local assessors to be the total taxable value of land and additions on the property. | Land | Improvement |
|---|---|---|---|---|
| 2024 | $3,055 | $63,140 | $15,050 | $48,090 |
| 2023 | $3,061 | $63,140 | $15,050 | $48,090 |
| 2022 | $2,757 | $49,390 | $10,120 | $39,270 |
| 2021 | $2,817 | $49,390 | $10,120 | $39,270 |
| 2020 | $2,853 | $49,390 | $10,120 | $39,270 |
| 2019 | $2,420 | $37,980 | $9,100 | $28,880 |
| 2018 | $2,453 | $37,980 | $9,100 | $28,880 |
| 2017 | $1,834 | $20,800 | $7,880 | $12,920 |
| 2016 | $1,230 | $20,800 | $7,880 | $12,920 |
| 2015 | $1,237 | $20,800 | $7,880 | $12,920 |
| 2014 | $1,257 | $20,800 | $7,880 | $12,920 |
| 2013 | $1,234 | $20,310 | $7,880 | $12,430 |
Source: Public Records
Map
Nearby Homes
- 177 Richards Dr
- 72 Colfret Ct
- 50 Perkins Ave
- 189 Delaware Dr
- 448 W William St
- 0 South St
- 175 Firestone Dr
- 383 Wheatfield Dr
- 431 Wheatfield Dr
- 106 Gold Dust Ct
- 362 Hearthstone Dr
- 169 Hillside Dr
- 312 W William St
- 297 W William St
- 736 Swanson St
- 413 Steeplechase St
- 327 Rockmill St
- 231 Rockmill St
- 25 David St
- 123 Helen Ct