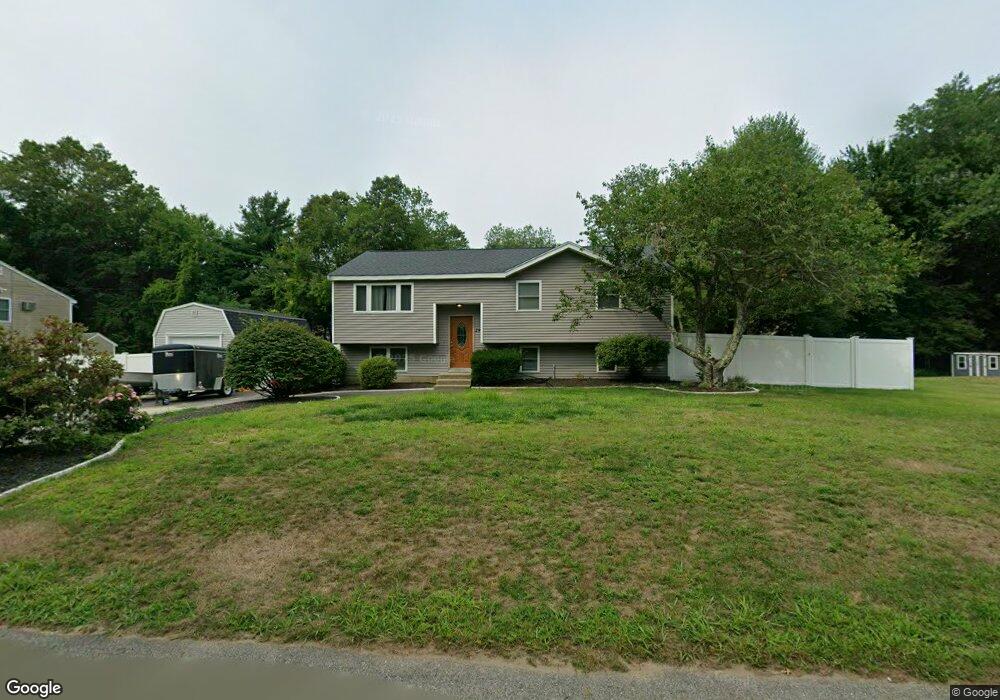
29 Wilbur St Norton, MA 02766
Estimated Value: $571,000 - $587,000
3
Beds
1
Bath
1,701
Sq Ft
$339/Sq Ft
Est. Value
About This Home
This home is located at 29 Wilbur St, Norton, MA 02766 and is currently estimated at $576,722, approximately $339 per square foot. 29 Wilbur St is a home located in Bristol County with nearby schools including L.G. Nourse Elementary School, Henri A. Yelle Elementary School, and Norton Middle School.
Ownership History
Date
Name
Owned For
Owner Type
Purchase Details
Closed on
Apr 8, 2010
Sold by
Peters Michael A
Bought by
Conti David S and Conti Kristina M
Current Estimated Value
Home Financials for this Owner
Home Financials are based on the most recent Mortgage that was taken out on this home.
Original Mortgage
$234,945
Outstanding Balance
$157,409
Interest Rate
5.12%
Mortgage Type
Purchase Money Mortgage
Estimated Equity
$419,313
Purchase Details
Closed on
Jun 9, 2006
Sold by
Peters Joanne M and Peters Michael A
Bought by
Peters Michael A
Home Financials for this Owner
Home Financials are based on the most recent Mortgage that was taken out on this home.
Original Mortgage
$225,000
Interest Rate
6.62%
Mortgage Type
Purchase Money Mortgage
Purchase Details
Closed on
Sep 29, 1992
Sold by
Lester Claire and Lester Donald
Bought by
Peters Michael A and Peters Joanne M
Home Financials for this Owner
Home Financials are based on the most recent Mortgage that was taken out on this home.
Original Mortgage
$110,700
Interest Rate
7.9%
Mortgage Type
Purchase Money Mortgage
Create a Home Valuation Report for This Property
The Home Valuation Report is an in-depth analysis detailing your home's value as well as a comparison with similar homes in the area
Home Values in the Area
Average Home Value in this Area
Purchase History
| Date | Buyer | Sale Price | Title Company |
|---|---|---|---|
| Conti David S | $230,000 | -- | |
| Peters Michael A | -- | -- | |
| Peters Michael A | $123,000 | -- |
Source: Public Records
Mortgage History
| Date | Status | Borrower | Loan Amount |
|---|---|---|---|
| Open | Conti David S | $234,945 | |
| Previous Owner | Peters Michael A | $225,000 | |
| Previous Owner | Peters Michael A | $160,000 | |
| Previous Owner | Peters Michael A | $123,400 | |
| Previous Owner | Peters Michael A | $110,700 |
Source: Public Records
Tax History Compared to Growth
Tax History
| Year | Tax Paid | Tax Assessment Tax Assessment Total Assessment is a certain percentage of the fair market value that is determined by local assessors to be the total taxable value of land and additions on the property. | Land | Improvement |
|---|---|---|---|---|
| 2025 | $58 | $445,500 | $181,200 | $264,300 |
| 2024 | $5,490 | $423,900 | $172,600 | $251,300 |
| 2023 | $5,196 | $400,000 | $162,800 | $237,200 |
| 2022 | $5,071 | $355,600 | $148,000 | $207,600 |
| 2021 | $4,804 | $321,800 | $140,900 | $180,900 |
| 2020 | $8,884 | $312,500 | $136,800 | $175,700 |
| 2019 | $8,576 | $291,900 | $131,600 | $160,300 |
| 2018 | $8,515 | $274,900 | $131,600 | $143,300 |
| 2017 | $7,986 | $258,200 | $131,600 | $126,600 |
| 2016 | $3,879 | $248,500 | $131,600 | $116,900 |
| 2015 | $3,741 | $243,100 | $129,000 | $114,100 |
| 2014 | $3,561 | $231,700 | $122,900 | $108,800 |
Source: Public Records
Map
Nearby Homes
- 6 Horton Dr
- 48 Codding Rd Unit 48
- 31 Owen Rd
- 12 Kayak Trail
- 195 E Main St
- 0 Knollwood & 0 Rear Kensington
- 0 S Washington St Unit 73437419
- 0 Kensington Rd
- 14 Downing Dr
- 8 Johnson Dr
- O Leonard St
- 15 S Washington St
- 1 Carlton Dr
- 38 S Washington St
- 23 Indian Rd
- 12 Sylvan Rd
- 10 Ridge Rd
- 0 Brook Pkwy
- 268 Reservoir St
- 15 Patten Rd