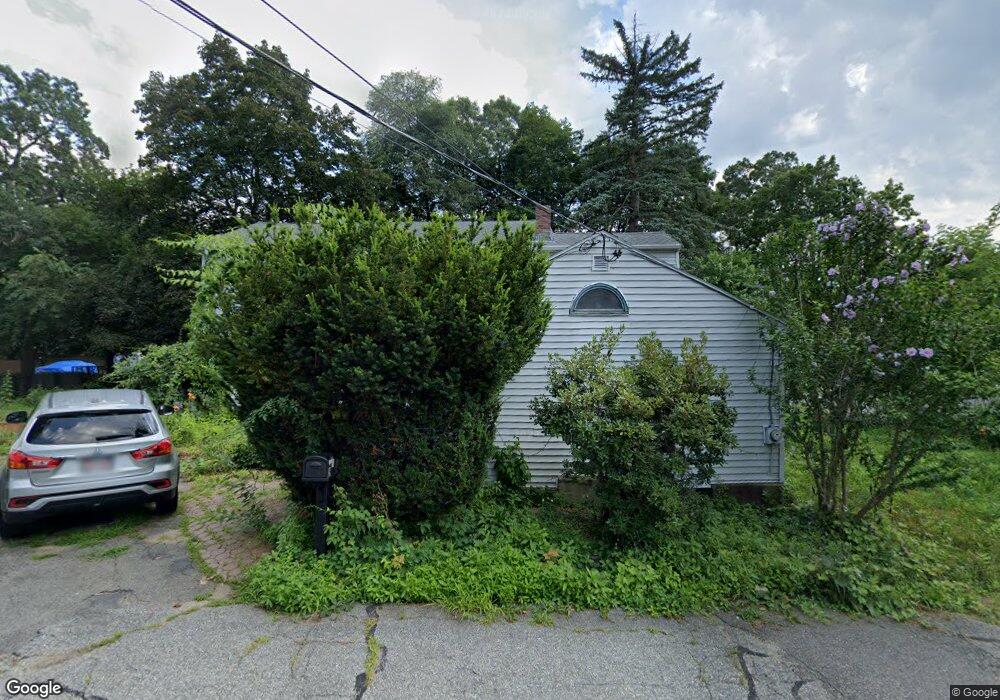
29 Wilson St Wilmington, MA 01887
Estimated Value: $748,638 - $834,000
5
Beds
2
Baths
2,171
Sq Ft
$366/Sq Ft
Est. Value
About This Home
This home is located at 29 Wilson St, Wilmington, MA 01887 and is currently estimated at $794,910, approximately $366 per square foot. 29 Wilson St is a home located in Middlesex County with nearby schools including Wilmington Middle School, Wilmington High School, and Abundant Life Christian School and Childcare.
Ownership History
Date
Name
Owned For
Owner Type
Purchase Details
Closed on
Dec 24, 1996
Sold by
Flash Carlyle A and Flash Grace
Bought by
Dullea Joseph
Current Estimated Value
Home Financials for this Owner
Home Financials are based on the most recent Mortgage that was taken out on this home.
Original Mortgage
$147,400
Outstanding Balance
$14,875
Interest Rate
7.62%
Mortgage Type
Purchase Money Mortgage
Estimated Equity
$780,035
Purchase Details
Closed on
Aug 28, 1992
Sold by
Black Charles A
Bought by
Flash Carlyle A
Home Financials for this Owner
Home Financials are based on the most recent Mortgage that was taken out on this home.
Original Mortgage
$124,950
Interest Rate
8.09%
Mortgage Type
Purchase Money Mortgage
Create a Home Valuation Report for This Property
The Home Valuation Report is an in-depth analysis detailing your home's value as well as a comparison with similar homes in the area
Home Values in the Area
Average Home Value in this Area
Purchase History
| Date | Buyer | Sale Price | Title Company |
|---|---|---|---|
| Dullea Joseph | $150,000 | -- | |
| Flash Carlyle A | $147,000 | -- |
Source: Public Records
Mortgage History
| Date | Status | Borrower | Loan Amount |
|---|---|---|---|
| Open | Flash Carlyle A | $23,000 | |
| Closed | Flash Carlyle A | $13,868 | |
| Open | Flash Carlyle A | $147,400 | |
| Previous Owner | Flash Carlyle A | $124,950 |
Source: Public Records
Tax History Compared to Growth
Tax History
| Year | Tax Paid | Tax Assessment Tax Assessment Total Assessment is a certain percentage of the fair market value that is determined by local assessors to be the total taxable value of land and additions on the property. | Land | Improvement |
|---|---|---|---|---|
| 2025 | $6,852 | $598,400 | $262,300 | $336,100 |
| 2024 | $6,737 | $589,400 | $262,300 | $327,100 |
| 2023 | $6,307 | $528,200 | $238,500 | $289,700 |
| 2022 | $5,917 | $454,100 | $198,700 | $255,400 |
| 2021 | $5,858 | $423,300 | $180,600 | $242,700 |
| 2020 | $5,623 | $414,100 | $180,600 | $233,500 |
| 2019 | $5,459 | $397,000 | $171,900 | $225,100 |
| 2018 | $5,349 | $371,200 | $163,800 | $207,400 |
| 2017 | $5,260 | $364,000 | $161,100 | $202,900 |
| 2016 | $4,927 | $336,800 | $153,500 | $183,300 |
| 2015 | $4,754 | $330,800 | $153,500 | $177,300 |
| 2014 | $4,436 | $311,500 | $146,200 | $165,300 |
Source: Public Records
Map
Nearby Homes
- 5 Flynn Way
- 1 March Rd
- 27 Fairview Ave
- 12 Hamlin Ln
- 3 Oakdale Rd
- 17 Molloy Rd
- 9 Parker St
- 3 Strout Ave
- 203 Lowell St Unit 119
- 203 Lowell St Unit 115
- 203 Lowell St Unit 304
- 203 Lowell St Unit 220
- 203 Lowell St Unit 103
- 203 Lowell St Unit 306
- 7 Cross St Unit 306
- 7 Cross St Unit 304
- 7 Cross St Unit 205
- 61 Lowell St
- 3 Gordon Rd
- 5 Morse Ave