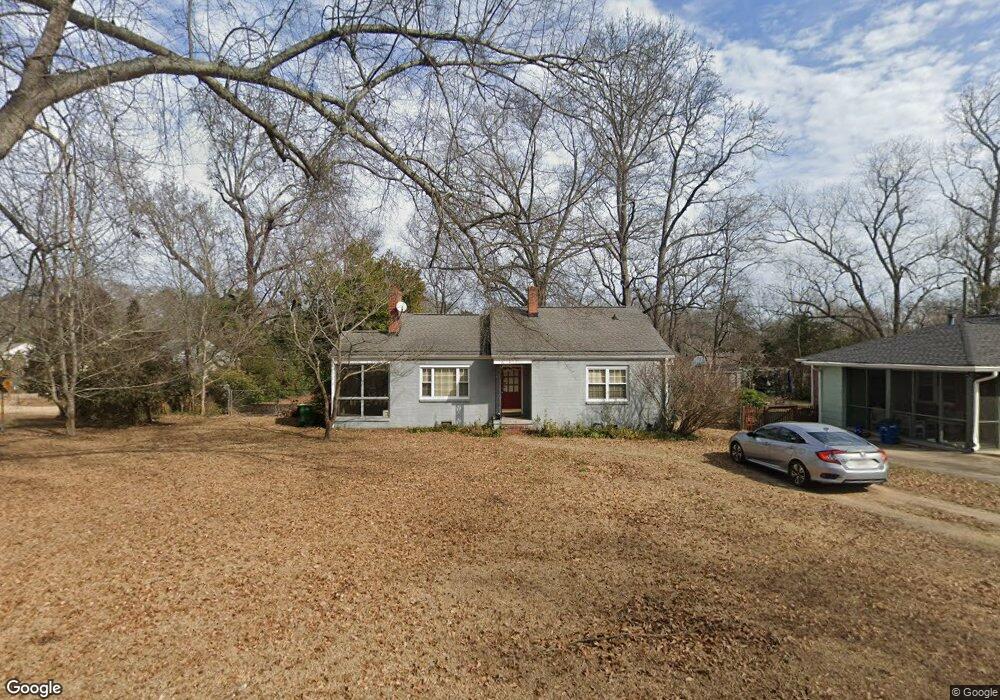
290 Best Dr Athens, GA 30606
Normaltown NeighborhoodEstimated Value: $397,000 - $438,036
2
Beds
1
Bath
1,355
Sq Ft
$313/Sq Ft
Est. Value
About This Home
This home is located at 290 Best Dr, Athens, GA 30606 and is currently estimated at $423,509, approximately $312 per square foot. 290 Best Dr is a home located in Clarke County with nearby schools including Johnnie Lay Burks Elementary School, Clarke Middle School, and Clarke Central High School.
Ownership History
Date
Name
Owned For
Owner Type
Purchase Details
Closed on
Nov 20, 2001
Sold by
Mcelhannon Ashley
Bought by
Johnson Alton F
Current Estimated Value
Purchase Details
Closed on
Nov 5, 1998
Sold by
Foster Cynthia A
Bought by
Mcelhannon Ashley
Purchase Details
Closed on
Feb 21, 1996
Sold by
Foster Cynthia A and Foster Virginia M
Bought by
Foster Cynthia A
Purchase Details
Closed on
Mar 20, 1992
Sold by
Bachman Michael J and Bachman Allison D
Bought by
Foster Cynthia A and Foste Virginia M
Create a Home Valuation Report for This Property
The Home Valuation Report is an in-depth analysis detailing your home's value as well as a comparison with similar homes in the area
Home Values in the Area
Average Home Value in this Area
Purchase History
| Date | Buyer | Sale Price | Title Company |
|---|---|---|---|
| Johnson Alton F | $127,900 | -- | |
| Mcelhannon Ashley | $85,000 | -- | |
| Foster Cynthia A | -- | -- | |
| Foster Cynthia A | $48,600 | -- |
Source: Public Records
Tax History Compared to Growth
Tax History
| Year | Tax Paid | Tax Assessment Tax Assessment Total Assessment is a certain percentage of the fair market value that is determined by local assessors to be the total taxable value of land and additions on the property. | Land | Improvement |
|---|---|---|---|---|
| 2024 | $4,444 | $152,025 | $44,000 | $108,025 |
| 2023 | $4,252 | $142,600 | $40,000 | $102,600 |
| 2022 | $3,420 | $117,202 | $40,000 | $77,202 |
| 2021 | $3,237 | $106,053 | $40,000 | $66,053 |
| 2020 | $3,035 | $100,052 | $36,000 | $64,052 |
| 2019 | $2,610 | $86,884 | $30,000 | $56,884 |
| 2018 | $2,469 | $82,716 | $30,000 | $52,716 |
| 2017 | $2,140 | $73,047 | $30,000 | $43,047 |
| 2016 | $1,903 | $66,044 | $30,000 | $36,044 |
| 2015 | $1,764 | $61,878 | $26,000 | $35,878 |
| 2014 | $1,586 | $56,544 | $22,000 | $34,544 |
Source: Public Records
Map
Nearby Homes