290 Casey Dr Chicopee, MA 01020
Fairview NeighborhoodEstimated Value: $355,403 - $412,000
3
Beds
1
Bath
1,382
Sq Ft
$270/Sq Ft
Est. Value
About This Home
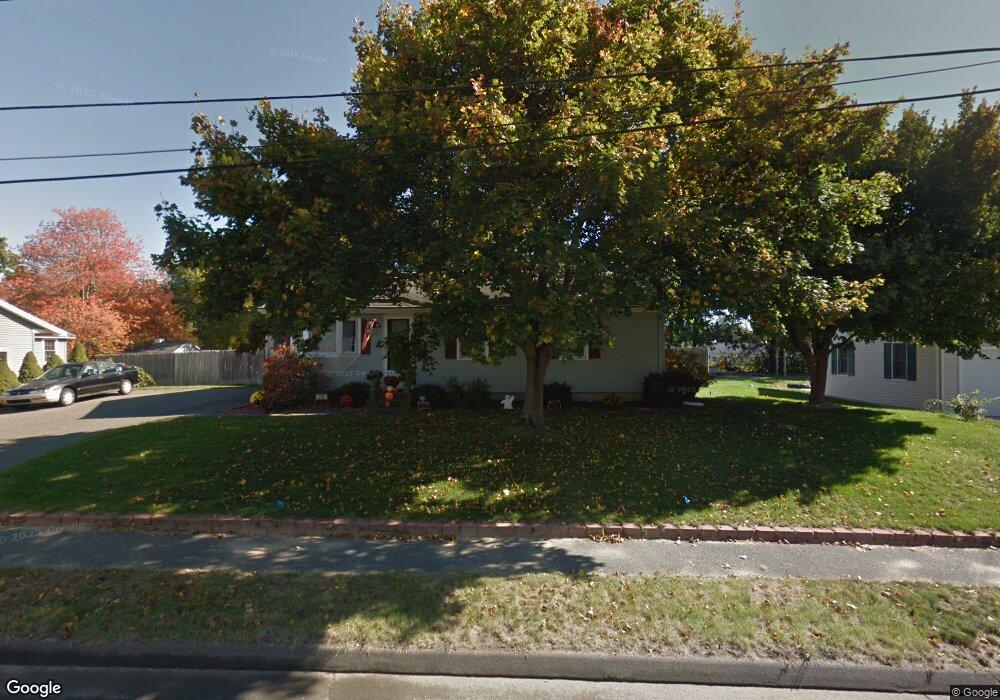
This home is located at 290 Casey Dr, Chicopee, MA 01020 and is currently estimated at $373,101, approximately $269 per square foot. 290 Casey Dr is a home located in Hampden County with nearby schools including Bowie Elementary School, Fairview Middle School, and Chicopee Comprehensive High School.
Ownership History
Date
Name
Owned For
Owner Type
Purchase Details
Closed on
Jul 22, 1994
Sold by
Michaels George T and Michaels Paula M
Bought by
Parent Christopher J and Parent Lisa A
Current Estimated Value
Purchase Details
Closed on
Oct 6, 1987
Sold by
Chilcote Terry J
Bought by
Michaels George T
Create a Home Valuation Report for This Property
The Home Valuation Report is an in-depth analysis detailing your home's value as well as a comparison with similar homes in the area
Home Values in the Area
Average Home Value in this Area
Purchase History
| Date | Buyer | Sale Price | Title Company |
|---|---|---|---|
| Parent Christopher J | $96,000 | -- | |
| Michaels George T | $98,000 | -- |
Source: Public Records
Mortgage History
| Date | Status | Borrower | Loan Amount |
|---|---|---|---|
| Open | Michaels George T | $114,000 | |
| Closed | Michaels George T | $82,000 | |
| Closed | Michaels George T | $12,490 |
Source: Public Records
Tax History
| Year | Tax Paid | Tax Assessment Tax Assessment Total Assessment is a certain percentage of the fair market value that is determined by local assessors to be the total taxable value of land and additions on the property. | Land | Improvement |
|---|---|---|---|---|
| 2025 | $4,772 | $314,800 | $112,100 | $202,700 |
| 2024 | $4,564 | $309,200 | $109,900 | $199,300 |
| 2023 | $4,228 | $279,100 | $99,800 | $179,300 |
| 2022 | $4,025 | $236,900 | $86,800 | $150,100 |
| 2021 | $3,848 | $218,500 | $78,900 | $139,600 |
| 2020 | $3,691 | $211,400 | $81,100 | $130,300 |
| 2019 | $3,630 | $202,100 | $81,100 | $121,000 |
| 2018 | $3,283 | $179,300 | $77,300 | $102,000 |
| 2017 | $3,050 | $176,200 | $70,900 | $105,300 |
| 2016 | $3,059 | $180,900 | $70,900 | $110,000 |
| 2015 | $3,008 | $171,500 | $70,900 | $100,600 |
| 2014 | $1,504 | $171,500 | $70,900 | $100,600 |
Source: Public Records
Map
Nearby Homes
- 70 Greenwood Terrace
- 37 Greenwood Terrace
- 58 Robinridge Rd
- 156 Horseshoe Dr
- 39 Dixie Terrace
- 144 Horseshoe Dr
- 60 Honeysuckle Dr
- 72 Honeysuckle Dr
- 52 Falmouth Rd
- 104 Johnson Rd Unit 1103
- 104 Johnson Rd Unit 707
- 1760 Westover Rd Unit 50
- 1760 Westover Rd Unit 5
- 1697 Westover Rd
- 119 Oakridge St
- 67 Streiber Dr
- 460 Irene St
- 111 Festival Cir
- 83 Old Farm Rd
- 20 Richmond Way
- 280 Casey Dr
- 300 Casey Dr
- 291 Casey Dr
- 270 Casey Dr
- 310 Casey Dr
- 279 Casey Dr
- 299 Casey Dr
- 17 Robinridge Rd
- 15 Robinridge Rd
- 17 Robinridge Rd Unit 60280 602B
- 269 Casey Dr
- 309 Casey Dr
- 320 Casey Dr
- 260 Casey Dr
- 239 Bostwick Ln
- 249 Bostwick Ln
- 229 Bostwick Ln
- 66 Greenwood Terrace
- 72 Greenwood Terrace
- 76 Greenwood Terrace
Your Personal Tour Guide
Ask me questions while you tour the home.