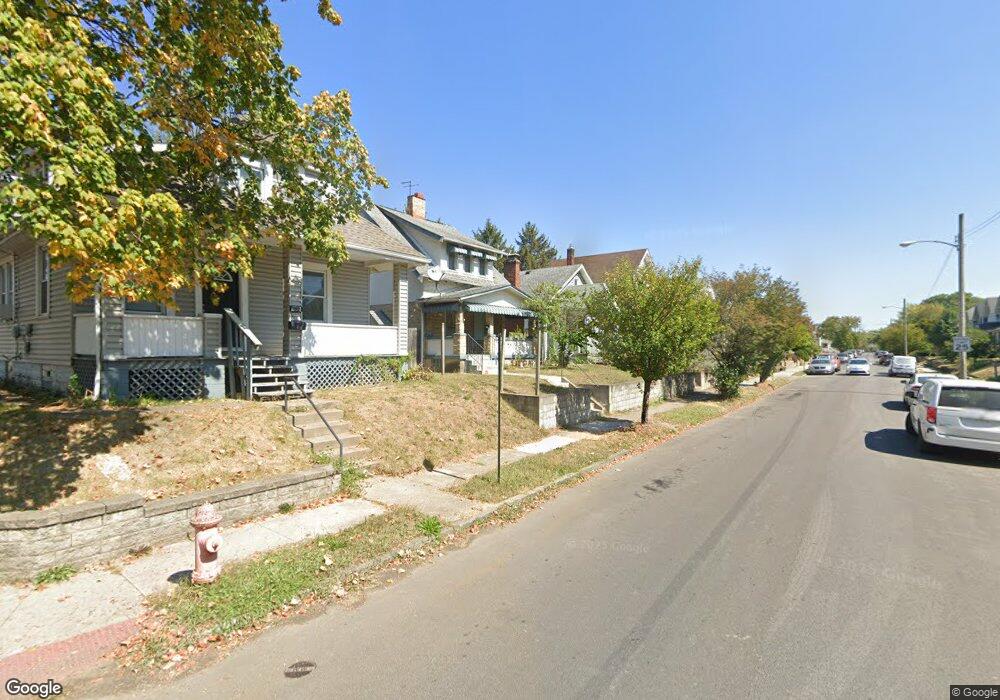
290 E Hinman Ave Columbus, OH 43207
Reeb-Hosack/Hungarian Village NeighborhoodEstimated Value: $208,055 - $239,000
2
Beds
1
Bath
1,076
Sq Ft
$211/Sq Ft
Est. Value
About This Home
This home is located at 290 E Hinman Ave, Columbus, OH 43207 and is currently estimated at $226,764, approximately $210 per square foot. 290 E Hinman Ave is a home located in Franklin County with nearby schools including Southwood Elementary School, South High School, and South Columbus Preparatory Academy.
Ownership History
Date
Name
Owned For
Owner Type
Purchase Details
Closed on
Jul 11, 2010
Sold by
Fifth Third Mortgage Company
Bought by
Halpern Susan B
Current Estimated Value
Purchase Details
Closed on
Jun 15, 2010
Sold by
Saine Anita and Case #09Cve 05 7751
Bought by
Fifth Third Mortgage Company
Purchase Details
Closed on
Aug 21, 2000
Sold by
Vick Properties Inc
Bought by
Cooney Renee
Home Financials for this Owner
Home Financials are based on the most recent Mortgage that was taken out on this home.
Original Mortgage
$57,600
Interest Rate
8.12%
Purchase Details
Closed on
Sep 2, 1999
Sold by
Morse Linda and Morse Scott R
Bought by
Vick Properties Inc
Purchase Details
Closed on
Jun 5, 1991
Purchase Details
Closed on
Apr 9, 1991
Create a Home Valuation Report for This Property
The Home Valuation Report is an in-depth analysis detailing your home's value as well as a comparison with similar homes in the area
Home Values in the Area
Average Home Value in this Area
Purchase History
| Date | Buyer | Sale Price | Title Company |
|---|---|---|---|
| Halpern Susan B | $25,000 | Attorney | |
| Fifth Third Mortgage Company | $44,000 | None Available | |
| Cooney Renee | $64,000 | -- | |
| Vick Properties Inc | $23,000 | Custom Title Services Inc | |
| -- | $20,000 | -- | |
| -- | $17,000 | -- |
Source: Public Records
Mortgage History
| Date | Status | Borrower | Loan Amount |
|---|---|---|---|
| Previous Owner | Cooney Renee | $57,600 |
Source: Public Records
Tax History
| Year | Tax Paid | Tax Assessment Tax Assessment Total Assessment is a certain percentage of the fair market value that is determined by local assessors to be the total taxable value of land and additions on the property. | Land | Improvement |
|---|---|---|---|---|
| 2025 | $3,250 | $70,910 | $19,880 | $51,030 |
| 2024 | $3,250 | $70,910 | $19,880 | $51,030 |
| 2023 | $3,385 | $74,795 | $19,880 | $54,915 |
| 2022 | $2,686 | $50,550 | $12,150 | $38,400 |
| 2021 | $2,691 | $50,550 | $12,150 | $38,400 |
| 2020 | $2,695 | $50,550 | $12,150 | $38,400 |
| 2019 | $2,296 | $36,930 | $9,000 | $27,930 |
| 2018 | $1,146 | $36,930 | $9,000 | $27,930 |
| 2017 | $2,296 | $36,930 | $9,000 | $27,930 |
| 2016 | $714 | $10,510 | $6,830 | $3,680 |
| 2015 | $325 | $10,510 | $6,830 | $3,680 |
| 2014 | $652 | $10,510 | $6,830 | $3,680 |
| 2013 | $321 | $10,500 | $6,825 | $3,675 |
Source: Public Records
Map
Nearby Homes
- 1624 S 8th St
- 332 E Hinman Ave
- 379 E Morrill Ave
- 236 E Welch Ave
- 284-286 E Markison Ave
- 220 E Welch Ave
- 301 Southwood Ave
- 218 E Markison Ave
- 1563 S 6th St
- 177 E Hinman Ave
- 1756 Bruck St
- 1692 Parsons Ave
- 1696 Parsons Ave
- 172 E Woodrow Ave
- 149 E Hinman Ave
- 464 E Hinman Ave
- 148 E Welch Ave
- 472 E Hinman Ave
- 130 E Woodrow Ave
- 457 E Woodrow Ave Unit 459
- 294 E Hinman Ave
- 284 E Hinman Ave
- 1674 S 8th St
- 300 E Hinman Ave
- 306 E Hinman Ave
- 0 E Hinman Ave
- 272 E Hinman Ave Unit 274
- 291 E Morrill Ave Unit 293
- 310 E Hinman Ave
- 297 E Morrill Ave
- 287 E Morrill Ave Unit 289
- 299 E Morrill Ave Unit 301
- 266 E Hinman Ave
- 287 E Hinman Ave Unit 289
- 287-289 E Hinman Ave
- 283 E Hinman Ave Unit 285
- 293 E Hinman Ave
- 273 E Morrill Ave
- 277 E Morrill Ave
- 309 E Morrill Ave
Your Personal Tour Guide
Ask me questions while you tour the home.