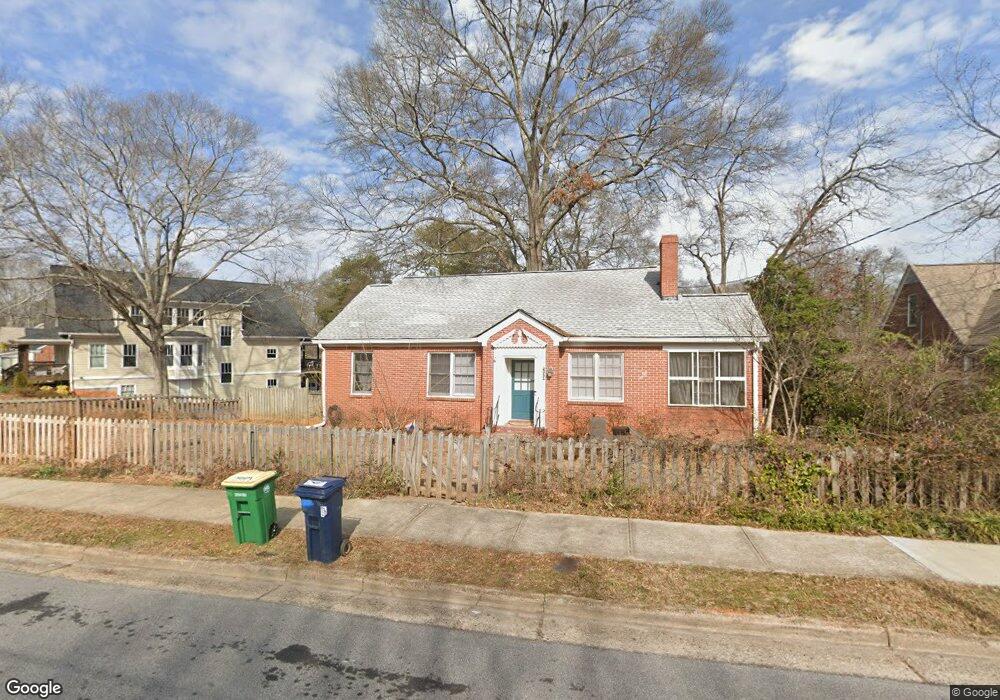
290 Holman Ave Athens, GA 30606
Normaltown NeighborhoodEstimated Value: $349,000 - $400,000
--
Bed
--
Bath
1,064
Sq Ft
$356/Sq Ft
Est. Value
About This Home
This home is located at 290 Holman Ave, Athens, GA 30606 and is currently estimated at $378,703, approximately $355 per square foot. 290 Holman Ave is a home located in Clarke County with nearby schools including Johnnie Lay Burks Elementary School, Clarke Middle School, and Clarke Central High School.
Ownership History
Date
Name
Owned For
Owner Type
Purchase Details
Closed on
Mar 27, 2015
Sold by
Walker Jeff A
Bought by
Walker Jeff A and German Laura A
Current Estimated Value
Purchase Details
Closed on
May 28, 2002
Sold by
Wondra Janet C and Walker Jeff A
Bought by
Walker Jeff A
Purchase Details
Closed on
May 10, 1996
Sold by
Aas-Larson Kris Christine Aas-Larson
Bought by
Wondra Janet C and Wondra Walker
Purchase Details
Closed on
Dec 13, 1993
Sold by
Clagett John H Carole B Clagett and Clagett John H
Bought by
Aas-Larson Kris Christine Aas-Larso
Purchase Details
Closed on
Sep 20, 1991
Sold by
Brown Andrew and Brown Amy
Bought by
Clagett John H Carole B Clagett and Clagett J
Create a Home Valuation Report for This Property
The Home Valuation Report is an in-depth analysis detailing your home's value as well as a comparison with similar homes in the area
Home Values in the Area
Average Home Value in this Area
Purchase History
| Date | Buyer | Sale Price | Title Company |
|---|---|---|---|
| Walker Jeff A | -- | -- | |
| Walker Jeff A | -- | -- | |
| Wondra Janet C | $79,900 | -- | |
| Aas-Larson Kris Christine Aas-Larso | $71,500 | -- | |
| Clagett John H Carole B Clagett | $66,900 | -- |
Source: Public Records
Tax History Compared to Growth
Tax History
| Year | Tax Paid | Tax Assessment Tax Assessment Total Assessment is a certain percentage of the fair market value that is determined by local assessors to be the total taxable value of land and additions on the property. | Land | Improvement |
|---|---|---|---|---|
| 2025 | $4,667 | $150,310 | $44,000 | $106,310 |
| 2024 | $4,667 | $140,680 | $44,000 | $96,680 |
| 2023 | $4,396 | $132,522 | $40,000 | $92,522 |
| 2022 | $3,950 | $123,815 | $40,000 | $83,815 |
| 2021 | $3,814 | $113,179 | $40,000 | $73,179 |
| 2020 | $3,604 | $106,956 | $36,000 | $70,956 |
| 2019 | $3,157 | $92,990 | $30,000 | $62,990 |
| 2018 | $3,000 | $88,358 | $30,000 | $58,358 |
| 2017 | $2,635 | $77,613 | $30,000 | $47,613 |
| 2016 | $2,371 | $69,831 | $30,000 | $39,831 |
| 2015 | $2,232 | $65,646 | $26,000 | $39,646 |
| 2014 | $2,049 | $60,164 | $22,000 | $38,164 |
Source: Public Records
Map
Nearby Homes