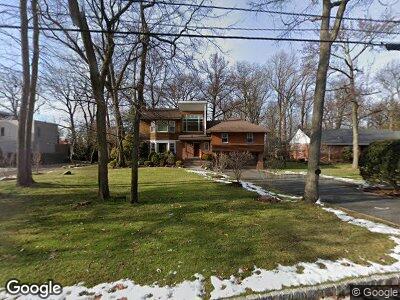
290 Morrow Rd Englewood, NJ 07631
Estimated Value: $1,428,148 - $1,802,000
--
Bed
--
Bath
3,643
Sq Ft
$454/Sq Ft
Est. Value
About This Home
This home is located at 290 Morrow Rd, Englewood, NJ 07631 and is currently estimated at $1,652,287, approximately $453 per square foot. 290 Morrow Rd is a home located in Bergen County with nearby schools including Dr J Grieco Elementary School, Dr Mccloud Elementary School, and J E Dismus Middle School.
Ownership History
Date
Name
Owned For
Owner Type
Purchase Details
Closed on
Feb 1, 2005
Sold by
Brown Ralph
Bought by
Gross Robert and Gross Abigail Hepner
Current Estimated Value
Home Financials for this Owner
Home Financials are based on the most recent Mortgage that was taken out on this home.
Original Mortgage
$1,000,000
Outstanding Balance
$542,083
Interest Rate
5.77%
Estimated Equity
$1,014,052
Purchase Details
Closed on
Jul 26, 2000
Sold by
Brown Ralph M
Bought by
Brown Ralph M and Barron Carol Ann
Purchase Details
Closed on
May 13, 1999
Sold by
Cordner Marie
Bought by
Brown Ralph M
Home Financials for this Owner
Home Financials are based on the most recent Mortgage that was taken out on this home.
Original Mortgage
$110,000
Interest Rate
6.92%
Mortgage Type
Unknown
Create a Home Valuation Report for This Property
The Home Valuation Report is an in-depth analysis detailing your home's value as well as a comparison with similar homes in the area
Home Values in the Area
Average Home Value in this Area
Purchase History
| Date | Buyer | Sale Price | Title Company |
|---|---|---|---|
| Gross Robert | $895,000 | -- | |
| Brown Ralph M | -- | -- | |
| Brown Ralph M | $459,000 | -- |
Source: Public Records
Mortgage History
| Date | Status | Borrower | Loan Amount |
|---|---|---|---|
| Open | Gross Robert | $1,000,000 | |
| Previous Owner | Brown Ralph M | $110,000 | |
| Previous Owner | Brown Ralph M | $240,000 |
Source: Public Records
Tax History Compared to Growth
Tax History
| Year | Tax Paid | Tax Assessment Tax Assessment Total Assessment is a certain percentage of the fair market value that is determined by local assessors to be the total taxable value of land and additions on the property. | Land | Improvement |
|---|---|---|---|---|
| 2024 | $25,375 | $851,500 | $514,000 | $337,500 |
| 2023 | $25,111 | $851,500 | $514,000 | $337,500 |
| 2022 | $25,111 | $851,500 | $514,000 | $337,500 |
| 2021 | $24,608 | $851,500 | $514,000 | $337,500 |
| 2020 | $23,970 | $851,500 | $514,000 | $337,500 |
| 2019 | $23,748 | $851,500 | $514,000 | $337,500 |
| 2018 | $23,178 | $851,500 | $514,000 | $337,500 |
| 2017 | $22,488 | $851,500 | $514,000 | $337,500 |
| 2016 | $21,773 | $851,500 | $514,000 | $337,500 |
| 2015 | $21,586 | $851,500 | $514,000 | $337,500 |
| 2014 | $21,407 | $851,500 | $514,000 | $337,500 |
Source: Public Records
Map
Nearby Homes
- 320 Lydecker St
- 388 Morrow Rd
- 140 Hillside Ave
- 130 Hillside Ave
- 468 Lydecker St
- 275 Engle St Unit G4
- 214 N Woodland St
- 277 Walnut St
- 210 N Woodland St
- 423 N Woodland St
- 45 Hillside Ave
- 277 Pindle Ave
- 35 Mayflower Dr
- 6 S Virginia Ct
- 241 Lyncrest Rd
- 151 E Palisade Ave Unit C8
- 185 E Palisade Ave Unit A6A
- 10 Lynn Dr
- 218 Waldo Place
- 74 Roberts Rd