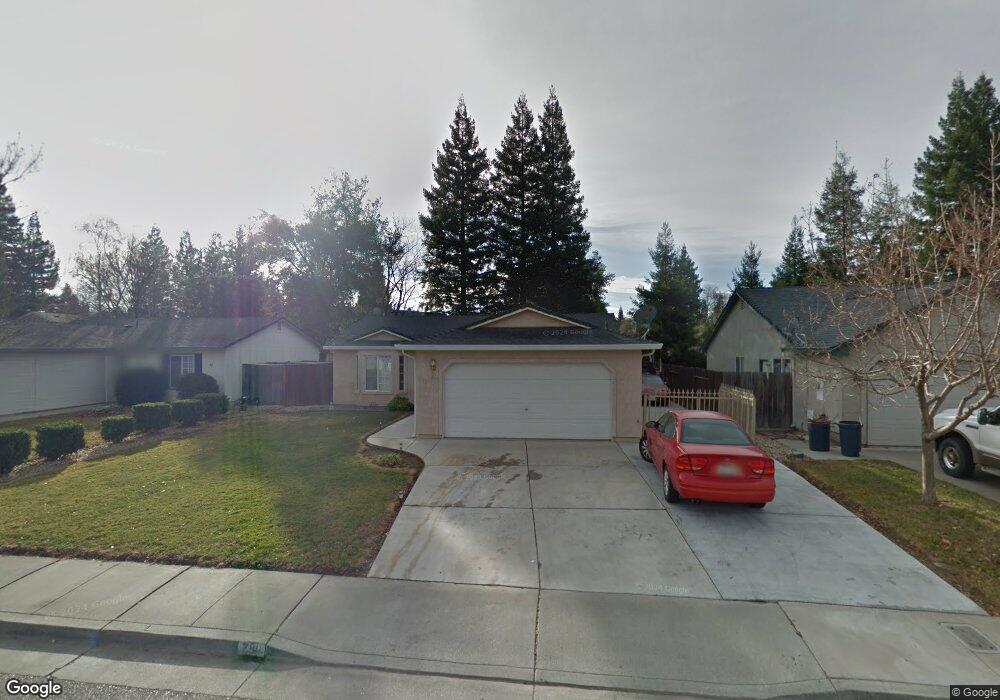
290 Pinon Way Red Bluff, CA 96080
Estimated Value: $260,000 - $312,464
3
Beds
2
Baths
1,121
Sq Ft
$258/Sq Ft
Est. Value
About This Home
This home is located at 290 Pinon Way, Red Bluff, CA 96080 and is currently estimated at $289,116, approximately $257 per square foot. 290 Pinon Way is a home located in Tehama County with nearby schools including Jackson Heights Elementary School, Vista Preparatory Academy, and Red Bluff High School.
Ownership History
Date
Name
Owned For
Owner Type
Purchase Details
Closed on
Jan 16, 2024
Sold by
Bluel Ricky
Bought by
Bluel Brandi
Current Estimated Value
Purchase Details
Closed on
Sep 26, 2023
Sold by
Frede Family Living Trust
Bought by
Bluel Brandi and Bluel Ricky
Home Financials for this Owner
Home Financials are based on the most recent Mortgage that was taken out on this home.
Original Mortgage
$241,200
Interest Rate
7.09%
Mortgage Type
New Conventional
Purchase Details
Closed on
Sep 22, 2022
Sold by
Zamacona Jose and Zamacona Ana Ruth
Bought by
Frede Family Living Trust
Create a Home Valuation Report for This Property
The Home Valuation Report is an in-depth analysis detailing your home's value as well as a comparison with similar homes in the area
Purchase History
| Date | Buyer | Sale Price | Title Company |
|---|---|---|---|
| Bluel Brandi | -- | None Listed On Document | |
| Bluel Brandi | $268,000 | Northern California Title | |
| Frede Family Living Trust | $260,000 | Northern California Title |
Source: Public Records
Mortgage History
| Date | Status | Borrower | Loan Amount |
|---|---|---|---|
| Previous Owner | Bluel Brandi | $241,200 |
Source: Public Records
Tax History
| Year | Tax Paid | Tax Assessment Tax Assessment Total Assessment is a certain percentage of the fair market value that is determined by local assessors to be the total taxable value of land and additions on the property. | Land | Improvement |
|---|---|---|---|---|
| 2025 | $2,777 | $273,360 | $66,300 | $207,060 |
| 2023 | $2,702 | $260,000 | $65,000 | $195,000 |
| 2022 | $1,401 | $139,744 | $36,199 | $103,545 |
| 2021 | $1,344 | $137,005 | $35,490 | $101,515 |
| 2020 | $1,371 | $135,602 | $35,127 | $100,475 |
| 2019 | $1,378 | $132,944 | $34,439 | $98,505 |
| 2018 | $1,273 | $130,338 | $33,764 | $96,574 |
| 2017 | $1,283 | $127,783 | $33,102 | $94,681 |
| 2016 | $1,197 | $125,278 | $32,453 | $92,825 |
| 2015 | $1,177 | $123,397 | $31,966 | $91,431 |
| 2014 | $1,159 | $120,980 | $31,340 | $89,640 |
Source: Public Records
Map
Nearby Homes
- 75 Sherman Dr
- 220 Gurnsey Dr
- 321 Antelope Blvd
- 55 Mina Ave
- 350 Gilmore Rd
- 350 Gilmore Rd Unit Space 88
- 350 Gilmore Rd Unit 16
- 100 Dale Ave
- 40 Sandy Way
- 5 Gurnsey Ave
- 275 Howell Ave
- 195 Howell Ave
- 65 Mary Ln
- 725 East Ave
- 105 Kimick Way
- 83 Damon Ave
- 125 Kimick Way
- 180 S Main St
- 846 Rio St
- 541 Jefferson St
Your Personal Tour Guide
Ask me questions while you tour the home.