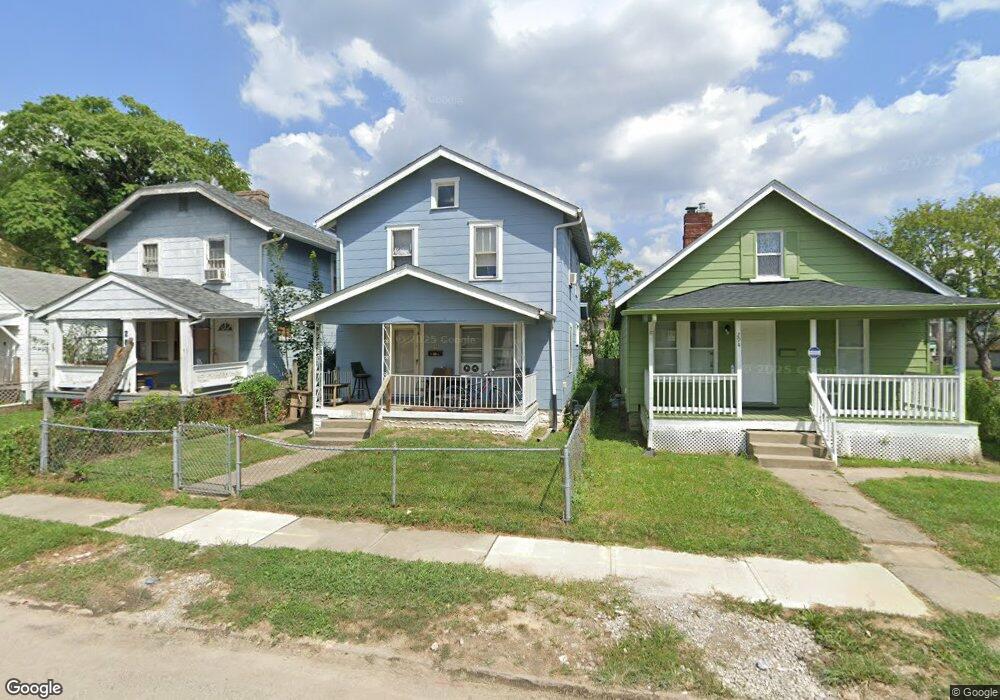
290 S Terrace Ave Columbus, OH 43204
Central Hilltop NeighborhoodEstimated Value: $115,000 - $140,000
2
Beds
1
Bath
1,086
Sq Ft
$116/Sq Ft
Est. Value
About This Home
This home is located at 290 S Terrace Ave, Columbus, OH 43204 and is currently estimated at $126,000, approximately $116 per square foot. 290 S Terrace Ave is a home located in Franklin County with nearby schools including Burroughs Elementary School, Hilltonia Middle School, and Briggs High School.
Ownership History
Date
Name
Owned For
Owner Type
Purchase Details
Closed on
Jul 26, 2019
Sold by
Eighty Property Group Llc
Bought by
Foundation First Properties Llc
Current Estimated Value
Purchase Details
Closed on
Jul 18, 2019
Sold by
Osgood Scott A
Bought by
Eightyplus Property Group Llc
Purchase Details
Closed on
Dec 2, 2011
Sold by
Morley Thomas
Bought by
Osgood Scott A
Purchase Details
Closed on
Jul 24, 2002
Sold by
Fannie Mae
Bought by
Morley Thomas
Purchase Details
Closed on
May 16, 2002
Sold by
Ferguson Karen
Bought by
Homeside Lending Inc
Purchase Details
Closed on
Oct 13, 1994
Sold by
Cook Denise A
Bought by
Karen Ferguson
Home Financials for this Owner
Home Financials are based on the most recent Mortgage that was taken out on this home.
Original Mortgage
$52,900
Interest Rate
8.55%
Mortgage Type
New Conventional
Purchase Details
Closed on
Oct 1, 1986
Purchase Details
Closed on
Apr 1, 1986
Create a Home Valuation Report for This Property
The Home Valuation Report is an in-depth analysis detailing your home's value as well as a comparison with similar homes in the area
Home Values in the Area
Average Home Value in this Area
Purchase History
| Date | Buyer | Sale Price | Title Company |
|---|---|---|---|
| Foundation First Properties Llc | $27,000 | Pm Title Box | |
| Eightyplus Property Group Llc | $19,000 | Landsel Title Box | |
| Osgood Scott A | $22,400 | Bxtalon Group | |
| Morley Thomas | $39,000 | Title First Agency Inc | |
| Federal National Mortgage Association | $39,000 | Title First Agency Inc | |
| Homeside Lending Inc | $35,000 | Independent Title | |
| Karen Ferguson | $52,900 | -- | |
| -- | $33,000 | -- | |
| -- | $10,500 | -- |
Source: Public Records
Mortgage History
| Date | Status | Borrower | Loan Amount |
|---|---|---|---|
| Previous Owner | Karen Ferguson | $52,900 |
Source: Public Records
Tax History Compared to Growth
Tax History
| Year | Tax Paid | Tax Assessment Tax Assessment Total Assessment is a certain percentage of the fair market value that is determined by local assessors to be the total taxable value of land and additions on the property. | Land | Improvement |
|---|---|---|---|---|
| 2024 | $1,375 | $30,000 | $5,640 | $24,360 |
| 2023 | $1,576 | $34,130 | $5,640 | $28,490 |
| 2022 | $1,321 | $13,660 | $1,510 | $12,150 |
| 2021 | $877 | $13,660 | $1,510 | $12,150 |
| 2020 | $947 | $13,660 | $1,510 | $12,150 |
| 2019 | $826 | $13,620 | $1,510 | $12,110 |
| 2018 | $836 | $13,620 | $1,510 | $12,110 |
| 2017 | $826 | $13,620 | $1,510 | $12,110 |
| 2016 | $933 | $14,080 | $3,890 | $10,190 |
| 2015 | $847 | $14,080 | $3,890 | $10,190 |
| 2014 | $849 | $14,080 | $3,890 | $10,190 |
| 2013 | $492 | $16,555 | $4,585 | $11,970 |
Source: Public Records
Map
Nearby Homes
- 274 S Richardson Ave
- 349 S Eureka Ave
- 224 S Terrace Ave
- 327-329 S Wayne Ave
- 238 S Richardson Ave
- 337 S Wayne Ave
- 232 S Burgess Ave
- 321 S Oakley Ave
- 426 S Eureka Ave
- 307 S Wheatland Ave
- 216 S Oakley Ave
- 310 S Ogden Ave
- 151 S Wayne Ave Unit 153
- 397 S Burgess Ave
- 350 S Ogden Ave
- 405 S Burgess Ave
- 121 N Terrace Ave
- 126 S Richardson Ave
- 471 S Terrace Ave Unit 473
- 219 S Ogden Ave
- 286 S Terrace Ave
- 294 S Terrace Ave
- 282 S Terrace Ave
- 298 S Terrace Ave
- 278 S Terrace Ave
- 272 S Terrace Ave
- 310 S Terrace Ave
- 291 S Eureka Ave
- 295 S Eureka Ave
- 268 S Terrace Ave
- 283 S Eureka Ave
- 299 S Eureka Ave
- 277 S Eureka Ave
- 314 S Terrace Ave
- 287 S Eureka Ave
- 275 S Eureka Ave
- 318 S Terrace Ave
- 309 S Eureka Ave
- 269 S Eureka Ave
- 267 S Eureka Ave