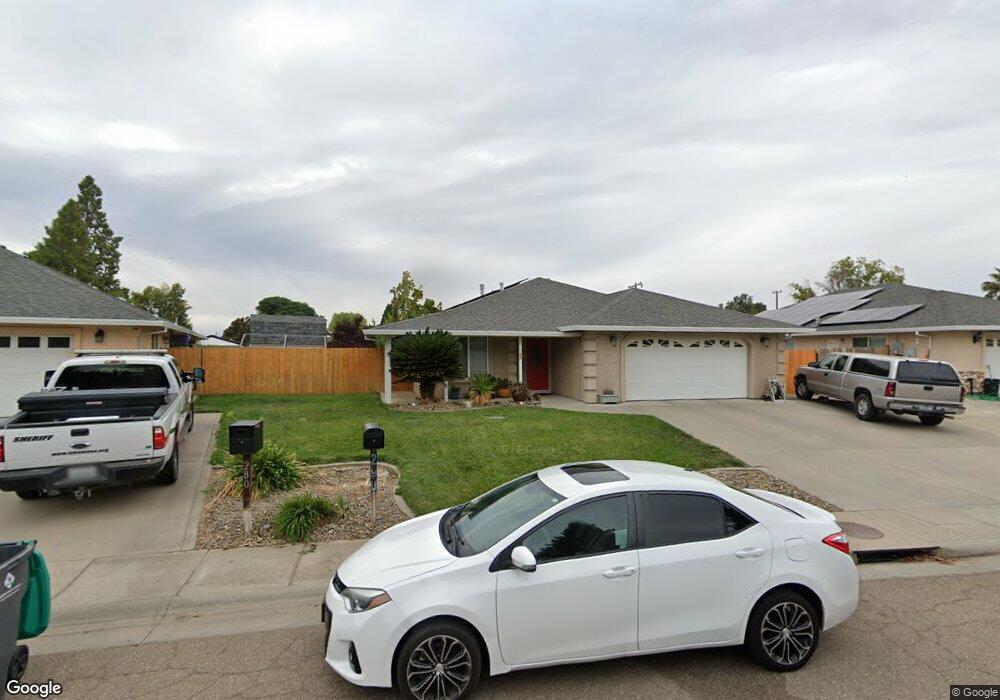
290 Shelly Way Red Bluff, CA 96080
Estimated Value: $341,000 - $382,000
3
Beds
2
Baths
1,698
Sq Ft
$212/Sq Ft
Est. Value
About This Home
This home is located at 290 Shelly Way, Red Bluff, CA 96080 and is currently estimated at $359,994, approximately $212 per square foot. 290 Shelly Way is a home located in Tehama County with nearby schools including Antelope Elementary School, Berrendos Middle School, and Red Bluff High School.
Ownership History
Date
Name
Owned For
Owner Type
Purchase Details
Closed on
Jul 31, 2017
Sold by
Beeman Tim and Beeman Natalie
Bought by
Lindeman Trevor and Lindeman Sarah
Current Estimated Value
Home Financials for this Owner
Home Financials are based on the most recent Mortgage that was taken out on this home.
Original Mortgage
$202,000
Outstanding Balance
$166,648
Interest Rate
3.9%
Mortgage Type
New Conventional
Estimated Equity
$193,346
Purchase Details
Closed on
Nov 5, 2012
Sold by
Jacobs Glenn B and Jacobs Glenn
Bought by
Beeman Tim and Beeman Natalie
Home Financials for this Owner
Home Financials are based on the most recent Mortgage that was taken out on this home.
Original Mortgage
$125,000
Interest Rate
3.33%
Mortgage Type
Seller Take Back
Purchase Details
Closed on
Jun 21, 2005
Sold by
Deadmond Brothers Construction Inc
Bought by
Beeman Tim and Beeman Natalie
Home Financials for this Owner
Home Financials are based on the most recent Mortgage that was taken out on this home.
Original Mortgage
$226,550
Interest Rate
5.72%
Mortgage Type
Fannie Mae Freddie Mac
Create a Home Valuation Report for This Property
The Home Valuation Report is an in-depth analysis detailing your home's value as well as a comparison with similar homes in the area
Purchase History
| Date | Buyer | Sale Price | Title Company |
|---|---|---|---|
| Lindeman Trevor | $202,000 | Northern California Title Co | |
| Beeman Tim | $150,000 | Northern California Title Co | |
| Beeman Tim | $283,500 | Chicago Title Co |
Source: Public Records
Mortgage History
| Date | Status | Borrower | Loan Amount |
|---|---|---|---|
| Open | Lindeman Trevor | $202,000 | |
| Previous Owner | Beeman Tim | $125,000 | |
| Previous Owner | Beeman Tim | $226,550 | |
| Closed | Beeman Tim | $56,650 |
Source: Public Records
Tax History
| Year | Tax Paid | Tax Assessment Tax Assessment Total Assessment is a certain percentage of the fair market value that is determined by local assessors to be the total taxable value of land and additions on the property. | Land | Improvement |
|---|---|---|---|---|
| 2025 | $3,493 | $259,420 | $51,200 | $208,220 |
| 2023 | $3,300 | $249,349 | $49,213 | $200,136 |
| 2022 | $3,097 | $244,461 | $48,249 | $196,212 |
| 2021 | $3,052 | $239,668 | $47,303 | $192,365 |
| 2020 | $3,051 | $237,211 | $46,818 | $190,393 |
| 2019 | $3,041 | $232,560 | $45,900 | $186,660 |
| 2018 | $2,943 | $228,000 | $45,000 | $183,000 |
| 2017 | $2,594 | $182,991 | $38,796 | $144,195 |
| 2016 | $2,414 | $174,278 | $36,949 | $137,329 |
| 2015 | -- | $174,278 | $36,949 | $137,329 |
| 2014 | $2,122 | $151,547 | $32,130 | $119,417 |
Source: Public Records
Map
Nearby Homes
- 508 Antoinette Ct
- 83 Damon Ave
- 566 Roundup Ave
- 65 Mary Ln
- 125 Kimick Way
- 105 Kimick Way
- 5 Gurnsey Ave
- 321 Antelope Blvd
- 23 Casa Grande Dr
- 100 Dale Ave
- 75 Sherman Dr
- 1 Casa Grande Dr Unit 1
- 220 Gurnsey Dr
- 139 Casa Grande Dr
- 147 Casa Grande Dr
- 135 Casa Grande Dr
- 123 Casa Grande Dr
- 101 Casa Grande Dr
- 13 Casa Grande Dr
- 176 Casa Grande Dr
- 300 Shelly Way
- 280 Shelly Way
- 310 Shelly Way
- 270 Shelly Way
- 295 Shelly Way
- 415 Berrendos Ave
- 260 Shelly Way
- 285 Kaer Ave
- 275 Kaer Ave
- 295 Kaer Ave Unit 295 Kaer Avenue
- 295 Kaer Ave
- 430 Monica Ct
- 265 Kaer Ave
- 245 Kaer Ave
- 255 Shelly Way
- 255 Shelley Way
- 250 Shelly Way
- 407 Berrendos Ave
- 435 Monica Ct
- 440 Monica Ct
Your Personal Tour Guide
Ask me questions while you tour the home.