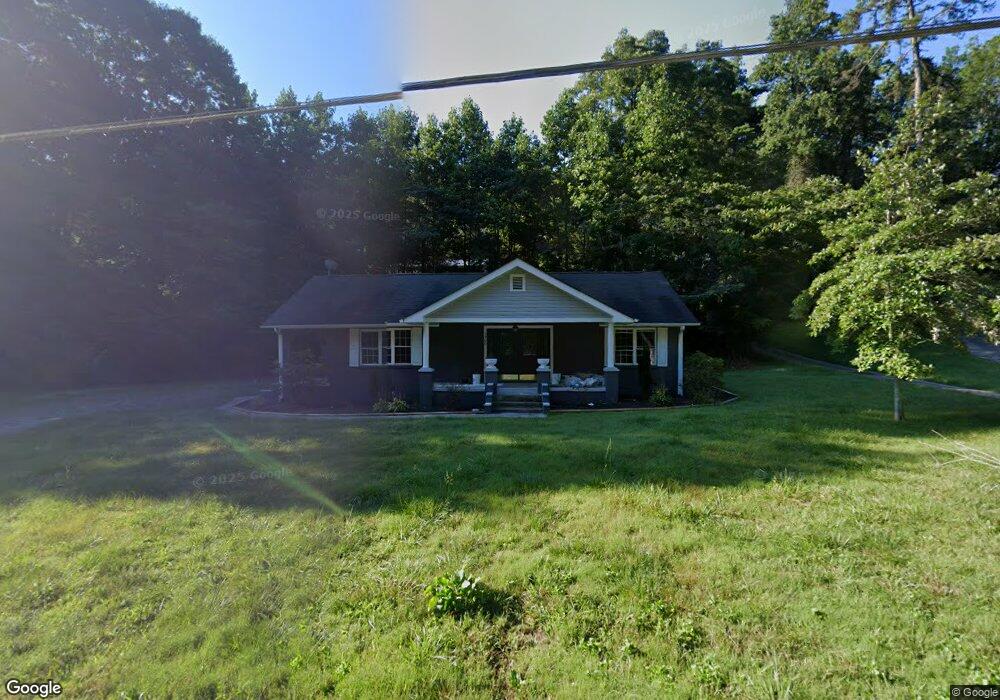
2900 Cedar Creek Rd La Follette, TN 37766
Estimated Value: $205,134 - $334,000
--
Bed
1
Bath
1,381
Sq Ft
$195/Sq Ft
Est. Value
About This Home
This home is located at 2900 Cedar Creek Rd, La Follette, TN 37766 and is currently estimated at $269,034, approximately $194 per square foot. 2900 Cedar Creek Rd is a home located in Campbell County.
Ownership History
Date
Name
Owned For
Owner Type
Purchase Details
Closed on
Mar 3, 2022
Sold by
Joshua Marcum
Bought by
Lindsay Tony and Lindsay Julie
Current Estimated Value
Purchase Details
Closed on
Oct 10, 2019
Sold by
Marcum Kristina and Marcum Robert Lee
Bought by
Marcum Joshua
Purchase Details
Closed on
Mar 29, 2011
Sold by
Peoples Bank Of The South
Bought by
Marcum Joe
Purchase Details
Closed on
Feb 18, 2011
Sold by
Chavis Michael L
Bought by
Peoples Bank Of The South
Purchase Details
Closed on
Oct 7, 2010
Sold by
Chavis Michael L
Bought by
Wilson Earl Ricky
Purchase Details
Closed on
Feb 22, 2008
Sold by
Peoples Bank Of The South
Bought by
Chavis Michael L
Purchase Details
Closed on
Jul 30, 2007
Sold by
Wilson Earl R
Bought by
Peoples Bank Of The South
Purchase Details
Closed on
Aug 13, 1991
Bought by
Wilson Earl R and Wilson Penny
Purchase Details
Closed on
Aug 12, 1991
Bought by
Wilson Earl R and Wilson Penny
Purchase Details
Closed on
Oct 3, 1986
Bought by
Parker Hubert Harri
Purchase Details
Closed on
Apr 1, 1981
Purchase Details
Closed on
Jan 3, 1900
Create a Home Valuation Report for This Property
The Home Valuation Report is an in-depth analysis detailing your home's value as well as a comparison with similar homes in the area
Home Values in the Area
Average Home Value in this Area
Purchase History
| Date | Buyer | Sale Price | Title Company |
|---|---|---|---|
| Lindsay Tony | $85,000 | Terry Jim | |
| Lindsay Tony | $85,000 | Terry Jim | |
| Marcum Joshua | $78,100 | None Available | |
| Marcum Joe | $40,000 | -- | |
| Peoples Bank Of The South | $64,706 | -- | |
| Wilson Earl Ricky | -- | -- | |
| Chavis Michael L | $67,000 | -- | |
| Peoples Bank Of The South | $67,000 | -- | |
| Wilson Earl R | $4,000 | -- | |
| Wilson Earl R | -- | -- | |
| Parker Hubert Harri | -- | -- | |
| -- | -- | -- | |
| -- | -- | -- |
Source: Public Records
Tax History Compared to Growth
Tax History
| Year | Tax Paid | Tax Assessment Tax Assessment Total Assessment is a certain percentage of the fair market value that is determined by local assessors to be the total taxable value of land and additions on the property. | Land | Improvement |
|---|---|---|---|---|
| 2025 | $765 | $62,950 | $0 | $0 |
| 2024 | $765 | $62,950 | $13,725 | $49,225 |
| 2023 | $567 | $27,425 | $2,925 | $24,500 |
| 2022 | $567 | $27,425 | $2,925 | $24,500 |
| 2021 | $567 | $27,425 | $2,925 | $24,500 |
| 2020 | $556 | $27,425 | $2,925 | $24,500 |
| 2019 | $567 | $27,425 | $2,925 | $24,500 |
| 2018 | $582 | $25,850 | $2,800 | $23,050 |
| 2017 | $582 | $25,850 | $2,800 | $23,050 |
| 2016 | $582 | $25,850 | $2,800 | $23,050 |
| 2015 | $514 | $25,850 | $2,800 | $23,050 |
| 2014 | $514 | $25,850 | $2,800 | $23,050 |
| 2013 | -- | $25,850 | $2,800 | $23,050 |
Source: Public Records
Map
Nearby Homes
- 2473 Long Hollow Rd
- 689 Ivey Hollow Rd
- 309 Marina Ln
- 258 Marina Ln
- 0 Cedar Creek Rd
- 0 Mariner Point Rd
- 647 Coolidge Rd
- 174 Old Ivey Hollow Rd
- 129 Bridgeview Ln
- 679 Waterfront Tr
- 143 Northbridge Ln
- 143 N Bridge Ln
- 734 Waterfront Tr
- 286 Lewis White Ln
- 143 Hidden Ln
- 121 Hidden Ln
- lot 37 Pinnacle Ln
- 0 Cameron Loop Ln Unit 1302081
- 0 Cameron Loop Ln Unit 1311949
- 1184 Davis Chapel Rd
- 2900 Cedar Creek Rd
- 2906 Cedar Creek Rd
- 2918 Cedar Creek Rd
- 2938 Cedar Creek Rd
- 2860 Cedar Creek Rd
- 2972 Cedar Creek Rd
- 279 Miller Fork Ln
- 2982 Cedar Creek Rd
- 2979 Cedar Creek Rd
- 2989 Cedar Creek Rd
- 2824 Cedar Creek Rd
- 3004 Cedar Creek Rd
- 2790 Cedar Creek Rd
- 2793 Cedar Creek Rd
- 2793 Cedar Creek Rd
- 3079 Cedar Creek Rd
- 1228 Sugar Hollow Rd
- 3089 Cedar Creek Rd
- 2761 Cedar Creek Rd
- 312 S Coolidge Rd