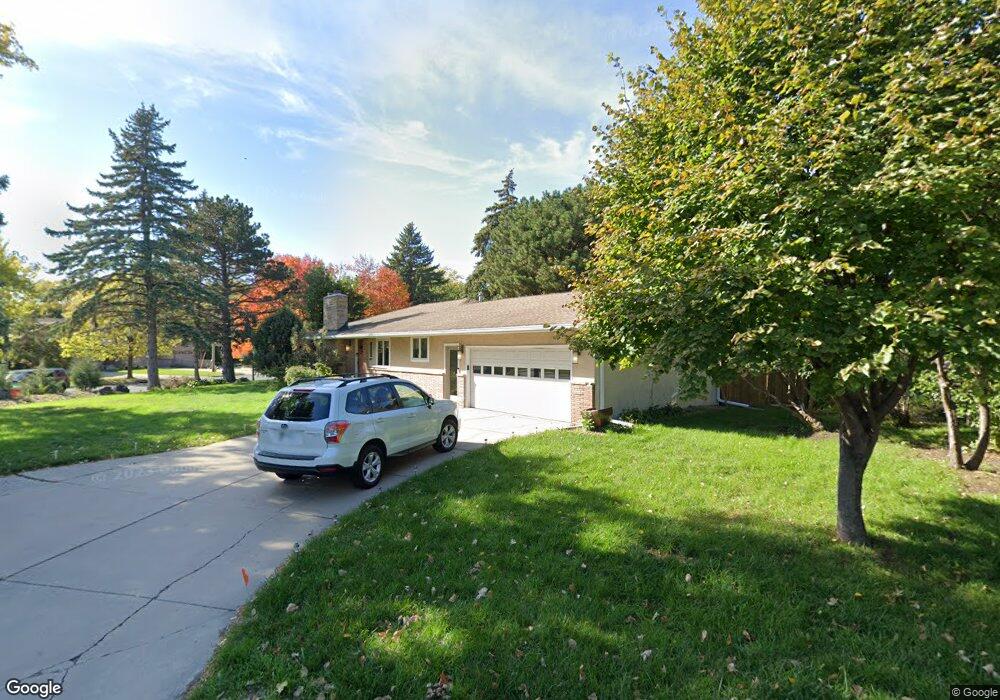
2900 Rankin Rd Saint Anthony, MN 55418
Estimated Value: $465,000 - $510,000
5
Beds
2
Baths
1,350
Sq Ft
$358/Sq Ft
Est. Value
About This Home
This home is located at 2900 Rankin Rd, Saint Anthony, MN 55418 and is currently estimated at $483,105, approximately $357 per square foot. 2900 Rankin Rd is a home located in Hennepin County with nearby schools including Wilshire Park Elementary School, Highland Elementary School, and St. Anthony Middle School.
Ownership History
Date
Name
Owned For
Owner Type
Purchase Details
Closed on
Nov 13, 2017
Sold by
Krenz Dennis and Krenz Dolly
Bought by
Friedrich Gregory and Lawson Angelia M
Current Estimated Value
Home Financials for this Owner
Home Financials are based on the most recent Mortgage that was taken out on this home.
Original Mortgage
$305,910
Outstanding Balance
$256,202
Interest Rate
3.83%
Mortgage Type
New Conventional
Estimated Equity
$226,903
Purchase Details
Closed on
Jun 3, 2005
Sold by
Quan Quac and Than Hien
Bought by
Krenz Dennis
Purchase Details
Closed on
May 22, 2004
Sold by
Quan Hai V
Bought by
Than Hien T and Quan Quoc A
Home Financials for this Owner
Home Financials are based on the most recent Mortgage that was taken out on this home.
Original Mortgage
$118,329
Interest Rate
5.5%
Mortgage Type
Land Contract Argmt. Of Sale
Purchase Details
Closed on
Jul 23, 2001
Sold by
Quan Hung V
Bought by
Quan Hai
Create a Home Valuation Report for This Property
The Home Valuation Report is an in-depth analysis detailing your home's value as well as a comparison with similar homes in the area
Home Values in the Area
Average Home Value in this Area
Purchase History
| Date | Buyer | Sale Price | Title Company |
|---|---|---|---|
| Friedrich Gregory | $339,900 | North American Title Co | |
| Krenz Dennis | $285,500 | -- | |
| Quan Quoc | $127,919 | -- | |
| Than Hien T | $190,000 | -- | |
| Quan Hai | $190,000 | -- |
Source: Public Records
Mortgage History
| Date | Status | Borrower | Loan Amount |
|---|---|---|---|
| Open | Friedrich Gregory | $305,910 | |
| Previous Owner | Than Hien T | $118,329 |
Source: Public Records
Tax History Compared to Growth
Tax History
| Year | Tax Paid | Tax Assessment Tax Assessment Total Assessment is a certain percentage of the fair market value that is determined by local assessors to be the total taxable value of land and additions on the property. | Land | Improvement |
|---|---|---|---|---|
| 2024 | $7,074 | $420,900 | $165,000 | $255,900 |
| 2023 | $7,261 | $443,200 | $185,000 | $258,200 |
| 2022 | $6,488 | $420,000 | $170,000 | $250,000 |
| 2021 | $6,067 | $391,000 | $179,000 | $212,000 |
| 2020 | $6,038 | $367,000 | $160,000 | $207,000 |
| 2019 | $5,799 | $348,000 | $145,000 | $203,000 |
| 2018 | $5,440 | $324,000 | $124,000 | $200,000 |
| 2017 | $4,917 | $263,000 | $110,000 | $153,000 |
| 2016 | $4,901 | $262,000 | $98,000 | $164,000 |
| 2015 | $4,516 | $231,000 | $94,000 | $137,000 |
| 2014 | -- | $202,000 | $84,000 | $118,000 |
Source: Public Records
Map
Nearby Homes
- 3212 29th Ave NE
- 2904 Old Highway 8
- 3013 Silver Lake Rd NE
- 2916 31st Ave NE
- 3153 Old Highway 8 Unit B103A
- 3153 Old Highway 8 Unit 304A
- 2164 Eustis St
- 3212 33rd Ave NE
- 3232 Old Highway 8
- 2601 Kenzie Terrace Unit 402
- 2601 Kenzie Terrace Unit 324
- 2601 Kenzie Terrace Unit 519
- 2601 Kenzie Terrace Unit 412
- 2601 Kenzie Terrace Unit 511
- 2601 Kenzie Terrace Unit 103
- 2501 NE Lowry Ave Unit 228
- 2501 NE Lowry Ave Unit 201
- 2911 Troseth Rd
- 2307 Harding St NE
- 3243 Mckinley St NE
- 2904 Rankin Rd
- 3305 29th Ave NE
- 3224 3224 29th-Avenue-ne
- 3224 3224 29th Ave NE
- 3301 29th Ave NE
- 3301 29th Ave NE
- 3304 E Gate Rd
- 3226 29th Ave NE
- 3224 29th Ave NE
- 2909 Rankin Rd
- 3222 29th Ave NE
- 2909 Rankin Rd
- 3300 E Gate Rd
- 3217 29th Ave NE
- 2911 Rankin Rd
- 2840 Highway 88
- 3220 29th Ave NE
- 2919 Crestview Dr
- 3213 29th Ave NE
- 2916 Rankin Rd