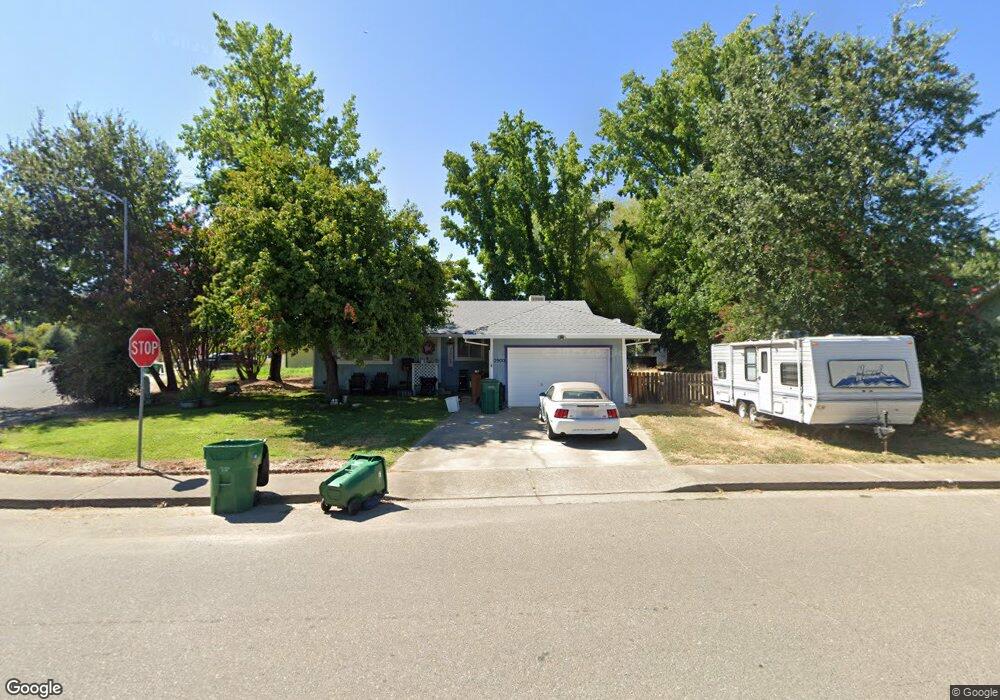
2900 Red Bud Dr Anderson, CA 96007
Balls Ferry Road NeighborhoodEstimated Value: $276,332 - $333,000
3
Beds
2
Baths
1,100
Sq Ft
$277/Sq Ft
Est. Value
About This Home
This home is located at 2900 Red Bud Dr, Anderson, CA 96007 and is currently estimated at $304,583, approximately $276 per square foot. 2900 Red Bud Dr is a home located in Shasta County with nearby schools including Meadow Lane Elementary School, Anderson Heights Elementary School, and Anderson Middle School.
Ownership History
Date
Name
Owned For
Owner Type
Purchase Details
Closed on
Feb 4, 2014
Sold by
Spaulding Alena
Bought by
Spaulding Rafe M
Current Estimated Value
Home Financials for this Owner
Home Financials are based on the most recent Mortgage that was taken out on this home.
Original Mortgage
$178,571
Outstanding Balance
$135,569
Interest Rate
4.46%
Mortgage Type
Purchase Money Mortgage
Estimated Equity
$169,014
Purchase Details
Closed on
May 29, 2009
Sold by
Greco Sally
Bought by
Greco Richard L
Home Financials for this Owner
Home Financials are based on the most recent Mortgage that was taken out on this home.
Original Mortgage
$88,480
Interest Rate
4.78%
Mortgage Type
Purchase Money Mortgage
Purchase Details
Closed on
Jan 27, 1999
Sold by
Pratt Maureen L
Bought by
Pratt Herbert R and Pratt Maureen L
Home Financials for this Owner
Home Financials are based on the most recent Mortgage that was taken out on this home.
Original Mortgage
$25,000
Interest Rate
6.73%
Mortgage Type
Credit Line Revolving
Create a Home Valuation Report for This Property
The Home Valuation Report is an in-depth analysis detailing your home's value as well as a comparison with similar homes in the area
Home Values in the Area
Average Home Value in this Area
Purchase History
| Date | Buyer | Sale Price | Title Company |
|---|---|---|---|
| Spaulding Rafe M | -- | Placer Title Company | |
| Spaulding Rafe M | $175,000 | Placer Title Company | |
| Greco Richard L | -- | Placer Title Company | |
| Greco Richard L | $112,000 | Placer Title Company | |
| Pratt Herbert R | -- | First American Title Co |
Source: Public Records
Mortgage History
| Date | Status | Borrower | Loan Amount |
|---|---|---|---|
| Open | Spaulding Rafe M | $178,571 | |
| Previous Owner | Greco Richard L | $88,480 | |
| Previous Owner | Pratt Herbert R | $25,000 |
Source: Public Records
Tax History
| Year | Tax Paid | Tax Assessment Tax Assessment Total Assessment is a certain percentage of the fair market value that is determined by local assessors to be the total taxable value of land and additions on the property. | Land | Improvement |
|---|---|---|---|---|
| 2025 | $2,643 | $214,515 | $55,157 | $159,358 |
| 2024 | $2,612 | $210,310 | $54,076 | $156,234 |
| 2023 | $2,612 | $206,187 | $53,016 | $153,171 |
| 2022 | $2,579 | $202,145 | $51,977 | $150,168 |
| 2021 | $2,615 | $198,182 | $50,958 | $147,224 |
| 2020 | $2,633 | $196,151 | $50,436 | $145,715 |
| 2019 | $2,503 | $192,306 | $49,448 | $142,858 |
| 2018 | $2,494 | $188,536 | $48,479 | $140,057 |
| 2017 | $2,518 | $184,840 | $47,529 | $137,311 |
| 2016 | $2,379 | $181,217 | $46,598 | $134,619 |
| 2015 | $2,386 | $178,496 | $45,899 | $132,597 |
| 2014 | $1,710 | $130,600 | $47,270 | $83,330 |
Source: Public Records
Map
Nearby Homes
- 2391 Shady Ln
- 2945 Silo Ct
- 2867 Pinto Ln
- 2606 Sapphire Ln
- 2863 Sandstone Dr
- 2705 Limestone Ct
- 3100 Driftstone Dr
- 3055 Sharon Ave
- 2648 Tremonto Rd
- 15.79 Stingy Ln
- 0 Stingy Ln
- 3006 Joyce Dr
- 2771 North St
- 3008 Hazel Dr
- 3267 E Bailey Dr
- 21133 Ronald St
- 3343 Oak St
- 3524 Gardenia St
- 0 North St
- 3535 Cazadero Way
Your Personal Tour Guide
Ask me questions while you tour the home.