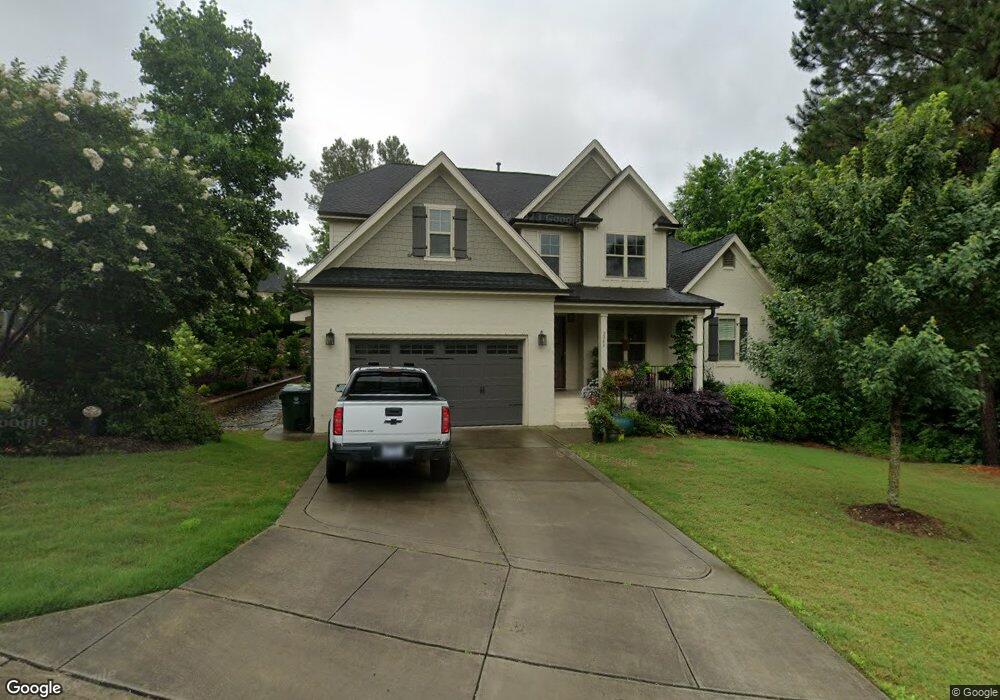
2900 Schubba Ct Unit 3785 Raleigh, NC 27614
Falls Lake NeighborhoodEstimated Value: $762,528 - $839,000
--
Bed
1
Bath
3,455
Sq Ft
$229/Sq Ft
Est. Value
About This Home
This home is located at 2900 Schubba Ct Unit 3785, Raleigh, NC 27614 and is currently estimated at $790,632, approximately $228 per square foot. 2900 Schubba Ct Unit 3785 is a home located in Wake County with nearby schools including Wakefield Elementary School, Wakefield Middle, and Wakefield High School.
Ownership History
Date
Name
Owned For
Owner Type
Purchase Details
Closed on
Jul 23, 2015
Sold by
Treeline Properties And Realty Llc
Bought by
Hubbard Julie L
Current Estimated Value
Home Financials for this Owner
Home Financials are based on the most recent Mortgage that was taken out on this home.
Original Mortgage
$310,100
Outstanding Balance
$117,126
Interest Rate
3.31%
Mortgage Type
New Conventional
Estimated Equity
$673,506
Purchase Details
Closed on
Jan 17, 2014
Sold by
Wilson Development Group Llc
Bought by
Treeline Properties & Realty Llc
Purchase Details
Closed on
Jun 14, 2011
Sold by
Tgl Wilson Llc
Bought by
Wilson Development Group Llc
Purchase Details
Closed on
Jun 1, 2005
Sold by
Wakefield Apartments 3 Investment Llc
Bought by
Tgl Wilson Llc
Create a Home Valuation Report for This Property
The Home Valuation Report is an in-depth analysis detailing your home's value as well as a comparison with similar homes in the area
Home Values in the Area
Average Home Value in this Area
Purchase History
| Date | Buyer | Sale Price | Title Company |
|---|---|---|---|
| Hubbard Julie L | $432,000 | Attorney | |
| Treeline Properties & Realty Llc | $65,000 | None Available | |
| Wilson Development Group Llc | -- | None Available | |
| Tgl Wilson Llc | $3,700,000 | -- |
Source: Public Records
Mortgage History
| Date | Status | Borrower | Loan Amount |
|---|---|---|---|
| Open | Hubbard Julie L | $310,100 |
Source: Public Records
Tax History Compared to Growth
Tax History
| Year | Tax Paid | Tax Assessment Tax Assessment Total Assessment is a certain percentage of the fair market value that is determined by local assessors to be the total taxable value of land and additions on the property. | Land | Improvement |
|---|---|---|---|---|
| 2025 | $6,389 | $730,264 | $110,000 | $620,264 |
| 2024 | $6,362 | $730,264 | $110,000 | $620,264 |
| 2023 | $4,688 | $428,230 | $65,000 | $363,230 |
| 2022 | $4,356 | $428,230 | $65,000 | $363,230 |
| 2021 | $4,187 | $428,230 | $65,000 | $363,230 |
| 2020 | $4,110 | $428,230 | $65,000 | $363,230 |
| 2019 | $5,182 | $445,379 | $66,000 | $379,379 |
| 2018 | $4,886 | $445,379 | $66,000 | $379,379 |
| 2017 | $4,653 | $445,379 | $66,000 | $379,379 |
| 2016 | $4,558 | $445,379 | $66,000 | $379,379 |
| 2015 | -- | $122,000 | $122,000 | $0 |
| 2014 | $1,198 | $122,000 | $122,000 | $0 |
Source: Public Records
Map
Nearby Homes
- 12308 Bunchgrass Ln
- 12301 Corvus Rd
- 12204 Kaysmount Ct
- 12400 Village Gate Way
- 12412 Fieldmist Dr
- 12452 Richmond Run Dr
- 10900 Common Oaks Dr
- 14200 Falls of Neuse Rd
- 12617 Richmond Run Dr
- 2301 Narrawood St
- 2306 Carriage Oaks Dr
- 2738 Garden Knoll Ln
- 2717 Cypress Point Ln
- 12511 Bellstone Ln
- 3005 Osterley St
- 3220 Queensland Rd
- 10606 Brookside Reserve Rd
- 10608 Brookside Reserve Rd
- 2561 Bent Green St
- 10610 Brookside Reserve Rd
- 2900 Schubba Ct
- 2908 Schubba Ct
- 12321 Angel Falls Rd
- 12401 Angel Falls Rd
- 12401 Angel Falls Rd Unit 3788
- 12311 Angel Falls Rd
- 2905 Schubba Ct
- 2905 Schubba Ct Unit 3783
- 2918 Schubba Ct
- 2909 Schubba Ct
- 2909 Schubba Ct Unit 3782
- 2901 Schubba Ct Unit 3784
- 2901 Schubba Ct
- 2913 Schubba Ct
- 2913 Schubba Ct Unit 3781
- 3000 Herdsman Way
- 3001 Herdsman Way
- 3001 Herdsman Way Unit 3790
- 2917 Schubba Ct
- 2932 London Bell Dr