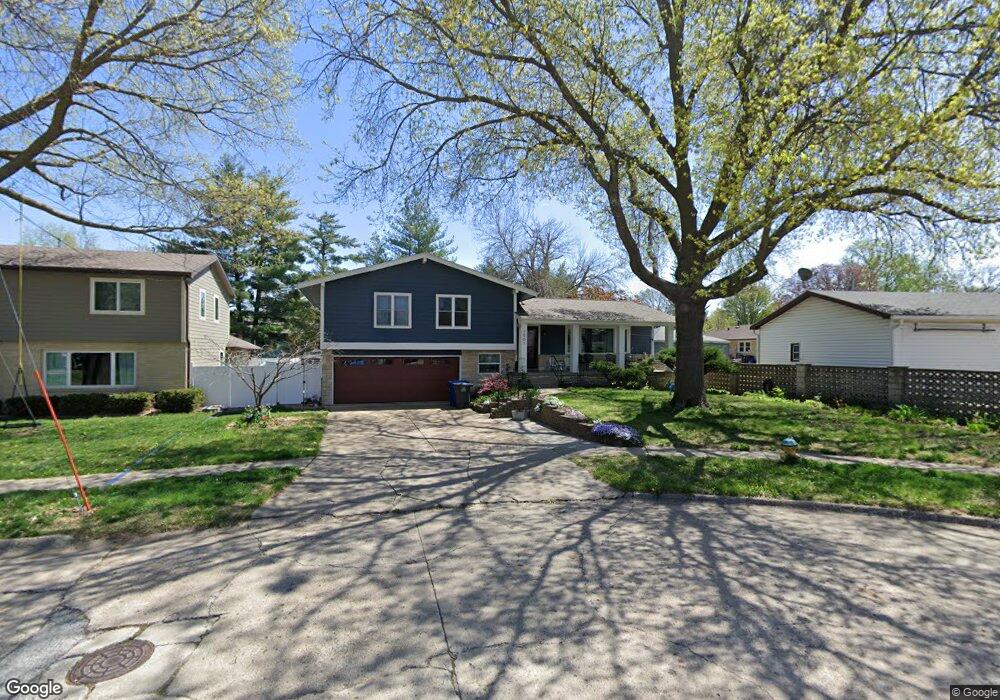
2901 39th St Des Moines, IA 50310
Beaverdale NeighborhoodEstimated Value: $270,000 - $301,000
4
Beds
3
Baths
1,404
Sq Ft
$200/Sq Ft
Est. Value
About This Home
This home is located at 2901 39th St, Des Moines, IA 50310 and is currently estimated at $281,004, approximately $200 per square foot. 2901 39th St is a home located in Polk County with nearby schools including Moore Elementary School, Meredith Middle School, and Hoover High School.
Ownership History
Date
Name
Owned For
Owner Type
Purchase Details
Closed on
Mar 13, 2012
Sold by
Revocabl Cleavenger John D and Lorraine Cleavenger Revocabl M
Bought by
Ocken Thomas J
Current Estimated Value
Home Financials for this Owner
Home Financials are based on the most recent Mortgage that was taken out on this home.
Original Mortgage
$125,242
Outstanding Balance
$85,226
Interest Rate
3.75%
Mortgage Type
FHA
Estimated Equity
$195,778
Purchase Details
Closed on
Mar 28, 2006
Sold by
Cleavenger M Lorraine
Bought by
Revocabl Cleavenger M Lorraine and Lorraine Cleavenger Revocabl M
Create a Home Valuation Report for This Property
The Home Valuation Report is an in-depth analysis detailing your home's value as well as a comparison with similar homes in the area
Home Values in the Area
Average Home Value in this Area
Purchase History
| Date | Buyer | Sale Price | Title Company |
|---|---|---|---|
| Ocken Thomas J | $128,000 | Itc | |
| Revocabl Cleavenger M Lorraine | -- | None Available |
Source: Public Records
Mortgage History
| Date | Status | Borrower | Loan Amount |
|---|---|---|---|
| Open | Ocken Thomas J | $125,242 |
Source: Public Records
Tax History Compared to Growth
Tax History
| Year | Tax Paid | Tax Assessment Tax Assessment Total Assessment is a certain percentage of the fair market value that is determined by local assessors to be the total taxable value of land and additions on the property. | Land | Improvement |
|---|---|---|---|---|
| 2025 | $4,298 | $254,100 | $64,600 | $189,500 |
| 2024 | $4,298 | $228,900 | $57,400 | $171,500 |
| 2023 | $4,392 | $228,900 | $57,400 | $171,500 |
| 2022 | $4,356 | $195,200 | $50,700 | $144,500 |
| 2021 | $4,358 | $195,200 | $50,700 | $144,500 |
| 2020 | $4,522 | $183,200 | $47,400 | $135,800 |
| 2019 | $4,278 | $183,200 | $47,400 | $135,800 |
| 2018 | $4,230 | $167,700 | $42,000 | $125,700 |
| 2017 | $3,854 | $167,700 | $42,000 | $125,700 |
| 2016 | $3,750 | $151,000 | $37,200 | $113,800 |
| 2015 | $3,750 | $151,000 | $37,200 | $113,800 |
| 2014 | $3,434 | $143,000 | $33,600 | $109,400 |
Source: Public Records
Map
Nearby Homes
- 3711 Adams Ave
- 3514 Urbandale Ave
- 3514 Davisson Rd
- 3501 Sheridan Ave
- 2614 40th Place
- 3605 Davisson Rd
- 2500 38th St
- 2421 39th St
- 3112 Beaver Ave
- 2419 40th Place
- 3301 34th St
- 4037 Amick Ave
- 2309 37th St
- 2409 Kenway Dr
- 2415 Hickman Rd
- 2310 35th St
- 4327 Sheridan Ave
- 3616 37th St
- 2513 33rd St
- 3112 Sheridan Ave