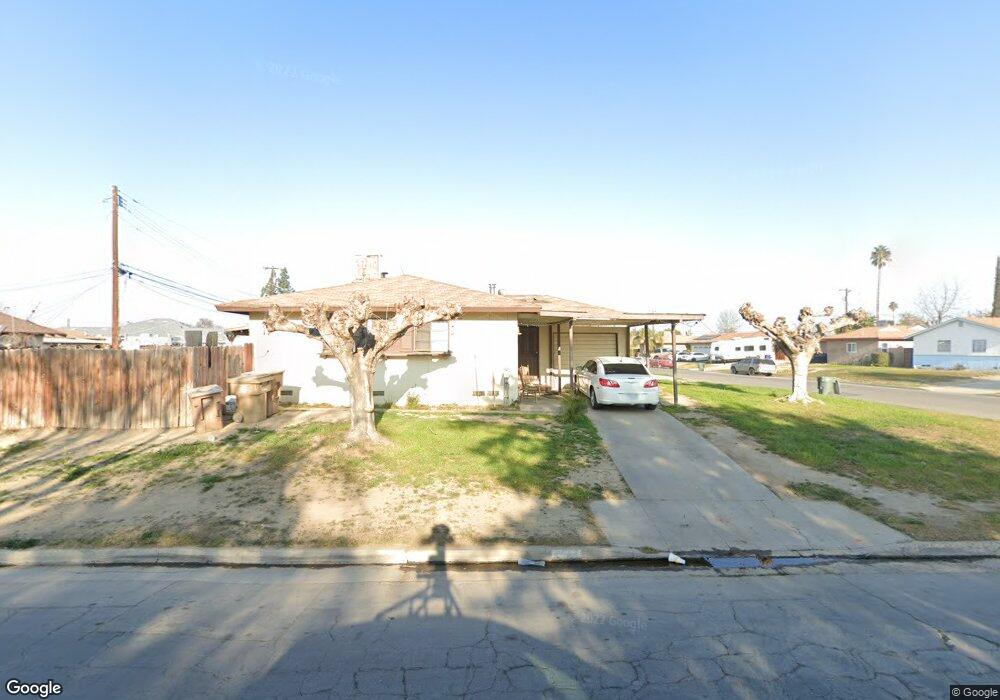
2901 Laurel Dr Bakersfield, CA 93304
Wible Orchard NeighborhoodEstimated Value: $242,951 - $281,000
2
Beds
1
Bath
930
Sq Ft
$283/Sq Ft
Est. Value
About This Home
This home is located at 2901 Laurel Dr, Bakersfield, CA 93304 and is currently estimated at $263,238, approximately $283 per square foot. 2901 Laurel Dr is a home located in Kern County with nearby schools including Frank West Elementary School, Curran Middle School, and South High School.
Ownership History
Date
Name
Owned For
Owner Type
Purchase Details
Closed on
Jul 23, 2008
Sold by
Us Bank Na
Bought by
Chavez Joel and Zamora Elia J Gomez
Current Estimated Value
Home Financials for this Owner
Home Financials are based on the most recent Mortgage that was taken out on this home.
Original Mortgage
$84,397
Outstanding Balance
$54,996
Interest Rate
6.27%
Mortgage Type
FHA
Estimated Equity
$208,242
Purchase Details
Closed on
Dec 7, 2007
Sold by
Beltran Jorge Melendez
Bought by
Us Bank Na and Jpm Alt 2006-A1
Purchase Details
Closed on
Dec 2, 2005
Sold by
Hylton Tamara M and Doris E Harrison Irrevocable T
Bought by
Beltran Jorge Melendez
Home Financials for this Owner
Home Financials are based on the most recent Mortgage that was taken out on this home.
Original Mortgage
$159,960
Interest Rate
6.37%
Mortgage Type
Purchase Money Mortgage
Purchase Details
Closed on
Jul 29, 2002
Sold by
Harrison Doris E and The Thomas L & Doris E Harriso
Bought by
Hylton Tamara M and Doris E Harrison Irrevocable T
Create a Home Valuation Report for This Property
The Home Valuation Report is an in-depth analysis detailing your home's value as well as a comparison with similar homes in the area
Home Values in the Area
Average Home Value in this Area
Purchase History
| Date | Buyer | Sale Price | Title Company |
|---|---|---|---|
| Chavez Joel | $86,000 | First American Title Company | |
| Us Bank Na | $159,600 | None Available | |
| Beltran Jorge Melendez | $200,000 | First American Title | |
| Hylton Tamara M | -- | -- |
Source: Public Records
Mortgage History
| Date | Status | Borrower | Loan Amount |
|---|---|---|---|
| Open | Chavez Joel | $84,397 | |
| Previous Owner | Beltran Jorge Melendez | $159,960 |
Source: Public Records
Tax History
| Year | Tax Paid | Tax Assessment Tax Assessment Total Assessment is a certain percentage of the fair market value that is determined by local assessors to be the total taxable value of land and additions on the property. | Land | Improvement |
|---|---|---|---|---|
| 2025 | $1,985 | $110,729 | $38,623 | $72,106 |
| 2024 | $1,938 | $108,559 | $37,866 | $70,693 |
| 2023 | $1,938 | $106,431 | $37,124 | $69,307 |
| 2022 | $1,885 | $104,346 | $36,397 | $67,949 |
| 2021 | $1,698 | $102,301 | $35,684 | $66,617 |
| 2020 | $1,662 | $101,253 | $35,319 | $65,934 |
| 2019 | $1,628 | $101,253 | $35,319 | $65,934 |
| 2018 | $1,592 | $97,324 | $33,949 | $63,375 |
| 2017 | $1,579 | $95,417 | $33,284 | $62,133 |
| 2016 | $1,464 | $93,547 | $32,632 | $60,915 |
| 2015 | $1,199 | $70,000 | $18,000 | $52,000 |
| 2014 | $1,176 | $70,000 | $18,000 | $52,000 |
Source: Public Records
Map
Nearby Homes
- 1208 Lindsay Dr
- 1016 Meredith Dr
- 2709 Laurel Dr
- 1605 Sidney Dr
- 1312 Dorian Dr
- 3204 S I St
- 2909 S Chester Ave
- 3212 S P St
- 3201 Parkland Ct
- 2709 Lee Dr
- 4609 S H St
- 3000 S Chester Ave Unit SPC 46
- 3000 S Chester Ave Unit 12
- 3000 S Chester Ave Unit 53
- 3000 S Chester Ave Unit 104
- 2612 Lee Dr
- 1316 Emery Ave
- 2323 S J St
- 2701 Houchin Rd
- 1301 Emery Ave
- 1109 Lindsay Dr
- 2915 Laurel Dr
- 1115 Lindsay Dr
- 1114 Sidney Dr
- 2908 Laurel Dr
- 2904 Laurel Dr
- 2815 Laurel Dr
- 1201 Lindsay Dr
- 1104 Lindsay Dr
- 1200 Sidney Dr
- 2916 Laurel Dr
- 2900 Laurel Dr
- 1110 Lindsay Dr
- 2922 Laurel Dr
- 2832 Laurel Dr
- 1116 Lindsay Dr
- 1205 Lindsay Dr
- 1204 Sidney Dr
- 3000 Laurel Dr
- 1200 Lindsay Dr
Your Personal Tour Guide
Ask me questions while you tour the home.