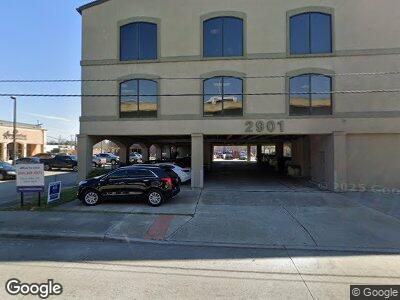
2901 N Causeway Blvd Unit 202 Metairie, LA 70002
Whitney-Cecile NeighborhoodEstimated Value: $340,000
--
Bed
--
Bath
645
Sq Ft
$527/Sq Ft
Est. Value
About This Home
This home is located at 2901 N Causeway Blvd Unit 202, Metairie, LA 70002 and is currently estimated at $340,000, approximately $527 per square foot. 2901 N Causeway Blvd Unit 202 is a home located in Jefferson Parish with nearby schools including J.C. Ellis Elementary School, Metairie Academy For Advanced Studies, and J.D. Meisler Middle School.
Create a Home Valuation Report for This Property
The Home Valuation Report is an in-depth analysis detailing your home's value as well as a comparison with similar homes in the area
Home Values in the Area
Average Home Value in this Area
Tax History Compared to Growth
Tax History
| Year | Tax Paid | Tax Assessment Tax Assessment Total Assessment is a certain percentage of the fair market value that is determined by local assessors to be the total taxable value of land and additions on the property. | Land | Improvement |
|---|---|---|---|---|
| 2024 | $595 | $11,580 | $2,960 | $8,620 |
| 2023 | $1,523 | $11,580 | $2,960 | $8,620 |
| 2022 | $1,484 | $11,580 | $2,960 | $8,620 |
| 2021 | $1,378 | $11,580 | $2,960 | $8,620 |
| 2020 | $1,368 | $11,580 | $2,960 | $8,620 |
| 2019 | $1,406 | $11,580 | $2,960 | $8,620 |
| 2018 | $1,313 | $11,580 | $2,960 | $8,620 |
| 2017 | $1,437 | $12,670 | $3,410 | $9,260 |
| 2016 | $1,409 | $12,670 | $3,410 | $9,260 |
| 2015 | $1,397 | $12,420 | $3,160 | $9,260 |
| 2014 | $1,397 | $12,420 | $3,160 | $9,260 |
Source: Public Records
Map
Nearby Homes
- 2901 Ridgelake Dr Unit 106
- 3013 Ridgelake Dr Unit 218
- 3101 N Causeway Blvd
- 3100 Ridgelake Dr
- 3125 N Causeway Blvd
- 2924 N Labarre Rd
- 3100 19th St
- 3000 Clifford Dr
- 3212 26th St
- 3105 N Labarre Rd
- 2914 Ridgeway Dr
- 2601 Metairie Lawn Dr Unit 119
- 2511 Metairie Lawn Dr Unit 104
- 2511 Metairie Lawn Dr Unit 117
- 3017 Edenborn Ave
- 3408 28th St
- 3316 N Labarre Rd
- 2610 N Hullen St
- 2901 N Causeway Blvd
- 2901 N Causeway Blvd
- 2901 N Causeway Blvd
- 2901 N Causeway Blvd
- 2901 N Causeway Blvd
- 2901 N Causeway Blvd Unit 203
- 2901 N Causeway Blvd Unit Suite
- 2901 N Causeway Blvd Unit 203 & 205
- 2901 N Causeway Blvd Unit 307
- 2901 N Causeway Blvd Unit 302
- 2901 N Causeway Blvd Unit 301
- 2901 N Causeway Blvd Unit 201
- 2901 N Causeway Blvd Unit 205
- 2901 N Causeway Blvd Unit 202
- 2901 N Causeway Blvd Unit 304
- 2929 N Causeway Blvd
- 2929 N Causeway Blvd Unit 2+3
- LOT 6 22nd St
- LOT 5 22nd St
- 2900 Ridgelake Dr