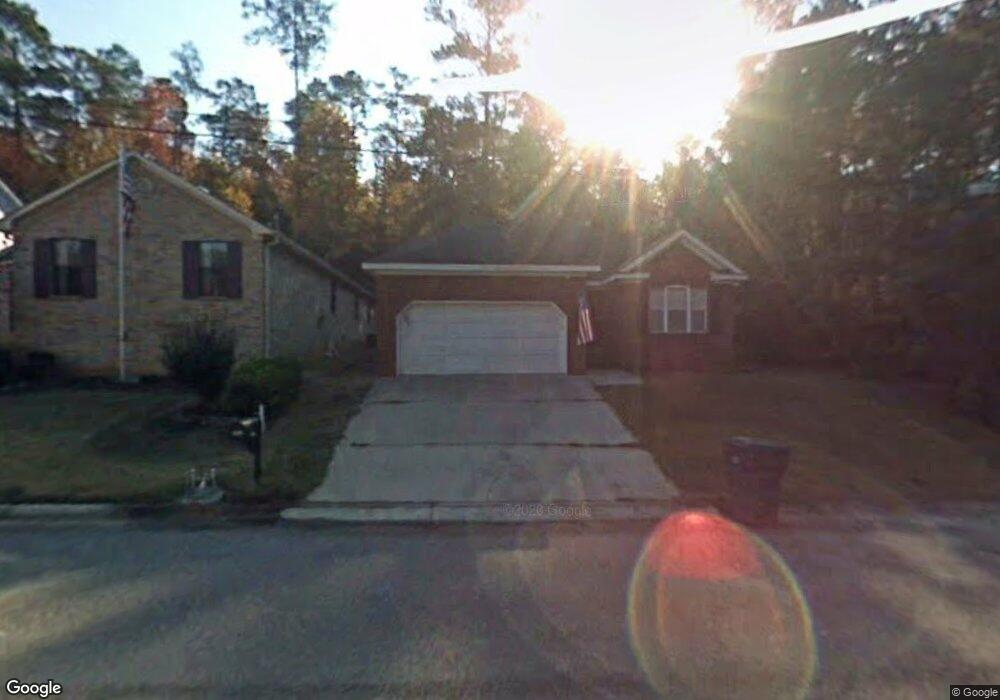
2901 Pointewest Dr Augusta, GA 30909
West Augusta NeighborhoodEstimated Value: $224,604 - $270,000
3
Beds
2
Baths
1,757
Sq Ft
$141/Sq Ft
Est. Value
About This Home
This home is located at 2901 Pointewest Dr, Augusta, GA 30909 and is currently estimated at $246,901, approximately $140 per square foot. 2901 Pointewest Dr is a home located in Richmond County with nearby schools including First Coast Technical Institute, R.B. Hunt Elementary School, and A. Brian Merry Elementary School.
Ownership History
Date
Name
Owned For
Owner Type
Purchase Details
Closed on
Dec 17, 2021
Sold by
Dowds Douglas R
Bought by
Dowds Sabrina Carson and Webb Ian Tayler
Current Estimated Value
Purchase Details
Closed on
Jun 17, 1997
Sold by
Dowds Douglas R Dowds Douglas
Bought by
Dowds Angela B
Purchase Details
Closed on
May 30, 1997
Sold by
Dowds Douglas R
Bought by
Dowds Angela B
Purchase Details
Closed on
Dec 24, 1991
Sold by
Tompkins J A By Att
Bought by
Dowds Douglas R
Purchase Details
Closed on
Nov 19, 1991
Sold by
Tompkins Benjamin J
Bought by
Tompkins J A
Purchase Details
Closed on
Oct 11, 1991
Sold by
Westbrook Of August
Bought by
Tompkins B J
Create a Home Valuation Report for This Property
The Home Valuation Report is an in-depth analysis detailing your home's value as well as a comparison with similar homes in the area
Home Values in the Area
Average Home Value in this Area
Purchase History
| Date | Buyer | Sale Price | Title Company |
|---|---|---|---|
| Dowds Sabrina Carson | $155,000 | -- | |
| Dowds Angela B | -- | -- | |
| Dowds Angela B | -- | -- | |
| Dowds Douglas R | $86,000 | -- | |
| Tompkins J A | -- | -- | |
| Tompkins B J | $47,000 | -- |
Source: Public Records
Tax History Compared to Growth
Tax History
| Year | Tax Paid | Tax Assessment Tax Assessment Total Assessment is a certain percentage of the fair market value that is determined by local assessors to be the total taxable value of land and additions on the property. | Land | Improvement |
|---|---|---|---|---|
| 2025 | $3,098 | $102,784 | $12,000 | $90,784 |
| 2024 | $3,098 | $86,896 | $12,000 | $74,896 |
| 2023 | $2,727 | $80,888 | $12,000 | $68,888 |
| 2022 | $2,132 | $62,000 | $11,000 | $51,000 |
| 2021 | $2,145 | $56,922 | $12,000 | $44,922 |
| 2020 | $2,112 | $56,922 | $12,000 | $44,922 |
| 2019 | $2,150 | $54,235 | $12,000 | $42,235 |
| 2018 | $2,165 | $54,235 | $12,000 | $42,235 |
| 2017 | $2,091 | $54,235 | $12,000 | $42,235 |
| 2016 | $2,092 | $54,235 | $12,000 | $42,235 |
| 2015 | $2,107 | $54,235 | $12,000 | $42,235 |
| 2014 | $1,946 | $54,235 | $12,000 | $42,235 |
Source: Public Records
Map
Nearby Homes
- 3007 Pointewest Dr
- 2609 Sherborne Ct
- 2918 Arrowhead Dr
- 2914 Westchester Dr
- 2901 Sussex Rd
- 2606 York Dr
- 2006 Glennfield Ln
- 1060 Bertram Rd
- 1058 Bertram Rd
- 2920 Sussex Rd
- 1056 Bertram Rd
- 2413 Woodbluff Ct
- 2330 Lions Gate Dr
- 2924 Mayfair Ct
- 104 York Way
- 2695 York Dr
- 2514 Commons Trace
- 2514 Commons Trc Trace
- 2507 Pinebluff Ct
- 2703 Oakbluff Ct
- 2903 Pointe Dr W
- 2903 Pointewest Dr
- 3004 Pointewest Dr
- 3004 Pointewest Dr
- 3006 Pointewest Dr
- 2905 Pointewest Dr
- 2905 Pointe Dr W
- 3006 Pointewest Dr
- 3008 Pointewest Dr
- 3008 Pointewest Dr
- 2969 Pointewest Dr
- 3010 Pointewest Dr
- 2907 Pointe Dr W
- 2907 Pointewest Dr
- 3003 Pointewest Dr Unit 2 A
- 3005 Pointewest Dr Unit 2B
- 3007 Pointewest Dr Unit 2C
- 3014 Pointewest Dr Unit 4 A
- 2909 Pointe Dr W
- 2967 Pointewest Dr