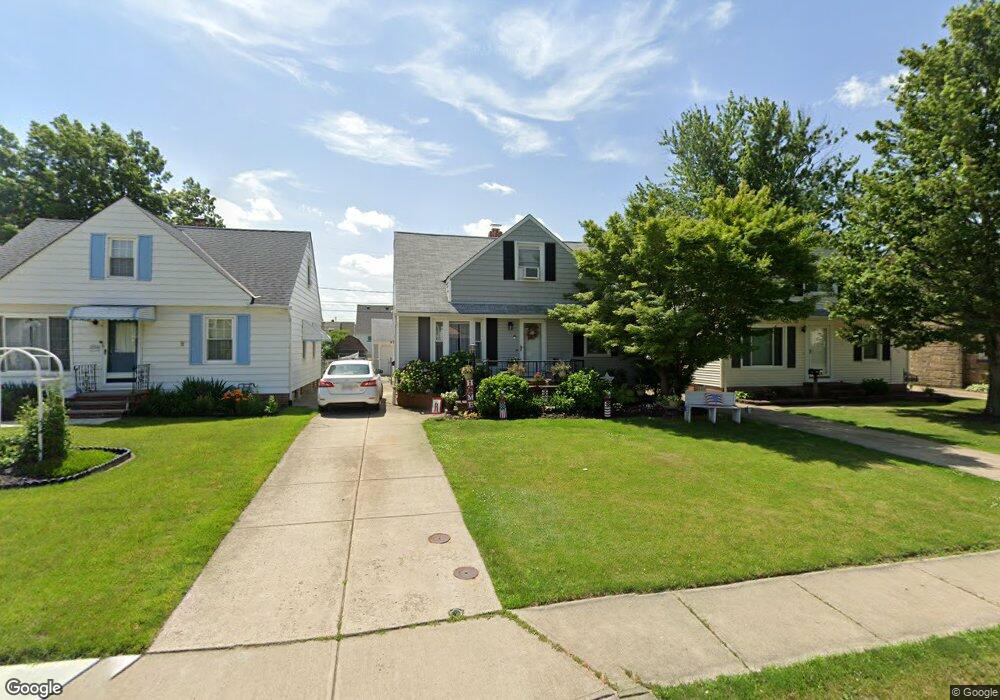
29014 Weber Ave Wickliffe, OH 44092
Estimated Value: $174,198 - $203,000
3
Beds
2
Baths
783
Sq Ft
$242/Sq Ft
Est. Value
About This Home
This home is located at 29014 Weber Ave, Wickliffe, OH 44092 and is currently estimated at $189,550, approximately $242 per square foot. 29014 Weber Ave is a home located in Lake County with nearby schools including Wickliffe Elementary School, Wickliffe Middle School, and Wickliffe High School.
Ownership History
Date
Name
Owned For
Owner Type
Purchase Details
Closed on
Sep 7, 2002
Sold by
Burrington David A and Burrington Wanda L
Bought by
Sevel Randolff K
Current Estimated Value
Home Financials for this Owner
Home Financials are based on the most recent Mortgage that was taken out on this home.
Original Mortgage
$96,000
Interest Rate
6.41%
Purchase Details
Closed on
May 3, 1997
Sold by
Wiltshire Robert L and Wilsthire Mildred J
Bought by
Burrington David A
Home Financials for this Owner
Home Financials are based on the most recent Mortgage that was taken out on this home.
Original Mortgage
$90,250
Interest Rate
8.05%
Purchase Details
Closed on
Jan 1, 1990
Bought by
Wiltshire Robert L
Create a Home Valuation Report for This Property
The Home Valuation Report is an in-depth analysis detailing your home's value as well as a comparison with similar homes in the area
Home Values in the Area
Average Home Value in this Area
Purchase History
| Date | Buyer | Sale Price | Title Company |
|---|---|---|---|
| Sevel Randolff K | $122,000 | Midland Title Security Inc | |
| Burrington David A | $95,000 | Realty Title Agency Inc | |
| Wiltshire Robert L | -- | -- |
Source: Public Records
Mortgage History
| Date | Status | Borrower | Loan Amount |
|---|---|---|---|
| Previous Owner | Sevel Randolff K | $96,000 | |
| Previous Owner | Burrington David A | $90,250 | |
| Closed | Sevel Randolff K | $10,000 |
Source: Public Records
Tax History
| Year | Tax Paid | Tax Assessment Tax Assessment Total Assessment is a certain percentage of the fair market value that is determined by local assessors to be the total taxable value of land and additions on the property. | Land | Improvement |
|---|---|---|---|---|
| 2025 | -- | $51,610 | $10,600 | $41,010 |
| 2024 | -- | $51,610 | $10,600 | $41,010 |
| 2023 | $4,665 | $37,930 | $9,040 | $28,890 |
| 2022 | $2,721 | $37,930 | $9,040 | $28,890 |
| 2021 | $2,732 | $37,930 | $9,040 | $28,890 |
| 2020 | $2,636 | $31,090 | $7,410 | $23,680 |
| 2019 | $2,634 | $31,090 | $7,410 | $23,680 |
| 2018 | $2,253 | $31,680 | $11,570 | $20,110 |
| 2017 | $2,231 | $31,680 | $11,570 | $20,110 |
| 2016 | $2,220 | $31,680 | $11,570 | $20,110 |
| 2015 | $2,181 | $31,680 | $11,570 | $20,110 |
| 2014 | $1,921 | $31,680 | $11,570 | $20,110 |
| 2013 | $1,920 | $31,680 | $11,570 | $20,110 |
Source: Public Records
Map
Nearby Homes
- 29136 Norman Ave
- 597 Hemlock Dr
- 670 Hemlock Dr
- 591 Hemlock Dr
- 730 Hemlock Dr
- 953 Bryn Mawr Ave
- 27190 Zeman Ave
- 815 E 272nd St
- 625 Lloyd Rd
- 26931 Shoreview Ave
- 26831 Shoreview Ave
- 866 Elmwood Ave
- 440 E 271st St
- 427 E 275th St
- 610 E 266th St
- 940 Talmadge Ave
- 411 E 270th St
- 26530 Shoreview Ave
- 29616 Grand Blvd
- 26430 Drakefield Ave
- 29010 Weber Ave
- 29018 Weber Ave
- 29004 Weber Ave
- 29022 Weber Ave
- 29002 Weber Ave
- 29026 Weber Ave
- 29019 Homewood Dr
- 29015 Homewood Dr
- 29023 Homewood Dr
- 29027 Homewood Dr
- 29009 Homewood Dr
- 28966 Weber Ave
- 29030 Weber Ave
- 29011 Weber Ave
- 29017 Weber Ave
- 29007 Weber Ave
- 29021 Weber Ave
- 29003 Weber Ave
- 29033 Homewood Dr
- 29005 Homewood Dr
Your Personal Tour Guide
Ask me questions while you tour the home.