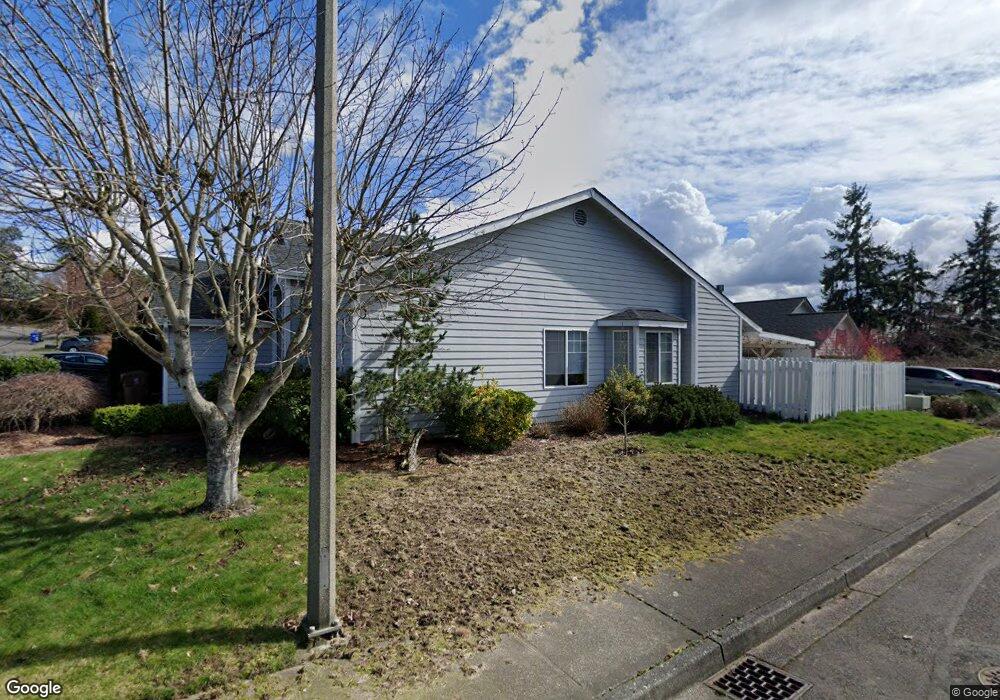
2902 47th St NE Tacoma, WA 98422
Northeast Tacoma NeighborhoodEstimated Value: $576,000 - $664,000
3
Beds
2
Baths
1,571
Sq Ft
$391/Sq Ft
Est. Value
About This Home
This home is located at 2902 47th St NE, Tacoma, WA 98422 and is currently estimated at $613,823, approximately $390 per square foot. 2902 47th St NE is a home located in Pierce County with nearby schools including Crescent Heights Elementary, Meeker Middle School, and Stadium High School.
Ownership History
Date
Name
Owned For
Owner Type
Purchase Details
Closed on
Jun 30, 2020
Sold by
Harvey Marion J
Bought by
Helferich Annie and Helferich Matthew
Current Estimated Value
Home Financials for this Owner
Home Financials are based on the most recent Mortgage that was taken out on this home.
Original Mortgage
$355,000
Outstanding Balance
$315,375
Interest Rate
3.2%
Mortgage Type
New Conventional
Estimated Equity
$298,448
Purchase Details
Closed on
Jun 26, 2001
Sold by
Marshall Marilyn Elaine
Bought by
Harvey James W and Harvey Marion J
Home Financials for this Owner
Home Financials are based on the most recent Mortgage that was taken out on this home.
Original Mortgage
$195,648
Interest Rate
7.14%
Mortgage Type
VA
Purchase Details
Closed on
Oct 24, 1996
Sold by
Geonerco Inc
Bought by
Graue Marilyn
Home Financials for this Owner
Home Financials are based on the most recent Mortgage that was taken out on this home.
Original Mortgage
$105,000
Interest Rate
8.11%
Create a Home Valuation Report for This Property
The Home Valuation Report is an in-depth analysis detailing your home's value as well as a comparison with similar homes in the area
Home Values in the Area
Average Home Value in this Area
Purchase History
| Date | Buyer | Sale Price | Title Company |
|---|---|---|---|
| Helferich Annie | $375,000 | Aegiis Land Title Group | |
| Harvey James W | $189,950 | Chicago Title | |
| Graue Marilyn | $181,083 | Chicago Title Insurance Co |
Source: Public Records
Mortgage History
| Date | Status | Borrower | Loan Amount |
|---|---|---|---|
| Open | Helferich Annie | $355,000 | |
| Previous Owner | Harvey James W | $195,648 | |
| Previous Owner | Graue Marilyn | $105,000 |
Source: Public Records
Tax History Compared to Growth
Tax History
| Year | Tax Paid | Tax Assessment Tax Assessment Total Assessment is a certain percentage of the fair market value that is determined by local assessors to be the total taxable value of land and additions on the property. | Land | Improvement |
|---|---|---|---|---|
| 2025 | $5,594 | $563,100 | $252,300 | $310,800 |
| 2024 | $5,594 | $531,200 | $221,600 | $309,600 |
| 2023 | $5,594 | $502,600 | $221,600 | $281,000 |
| 2022 | $4,962 | $497,300 | $239,900 | $257,400 |
| 2021 | $4,679 | $372,300 | $160,400 | $211,900 |
| 2019 | $4,205 | $348,500 | $140,300 | $208,200 |
| 2018 | $4,676 | $323,600 | $131,400 | $192,200 |
| 2017 | $4,429 | $296,100 | $122,000 | $174,100 |
| 2016 | $3,848 | $251,900 | $91,900 | $160,000 |
| 2014 | $3,565 | $221,400 | $82,500 | $138,900 |
| 2013 | $3,565 | $202,400 | $73,700 | $128,700 |
Source: Public Records
Map
Nearby Homes
- 3810 Browns Point Blvd NE
- 3001 45th St NE
- 3318 48th St NE
- 4329 Cliff Side Dr NE
- 3409 49th St NE
- 5313 Marine View Dr
- 4512 Browns Point Blvd
- 5402 Chinook Dr NE
- 4702 Browns Point Blvd NE
- 4320 Country Club Dr NE
- 2224 53rd Street Ct NE
- 5225 Ridge Dr NE
- 5309 Ridge Dr NE
- 4018 52nd St NE
- 1826 Browns Point Blvd
- 4714 Fairwood Blvd NE Unit 601
- 4714 Fairwood Blvd NE Unit 1704
- 2117 54th Street Ct NE
- 2201 Hillside Dr NE
- 5213 Norpoint Way NE
- 2910 47th St NE
- 2920 47th St NE
- 4624 29th Ave NE
- 4620 29th Ave NE
- 4628 29th Ave NE
- 3002 47th St NE
- 2901 47th St NE
- 4702 30th Ave NE
- 4614 29th Ave NE
- 2823 47th St NE
- 3008 47th St NE
- 2815 47th St NE
- 4610 29th Ave NE
- 3009 46th Street Ct NE
- 4708 30th Ave NE
- 2802 47th St NE
- 3815 Browns Point Blvd
- 3815 Browns Point Blvd
- 2807 47th St NE
- 2906 48th St NE