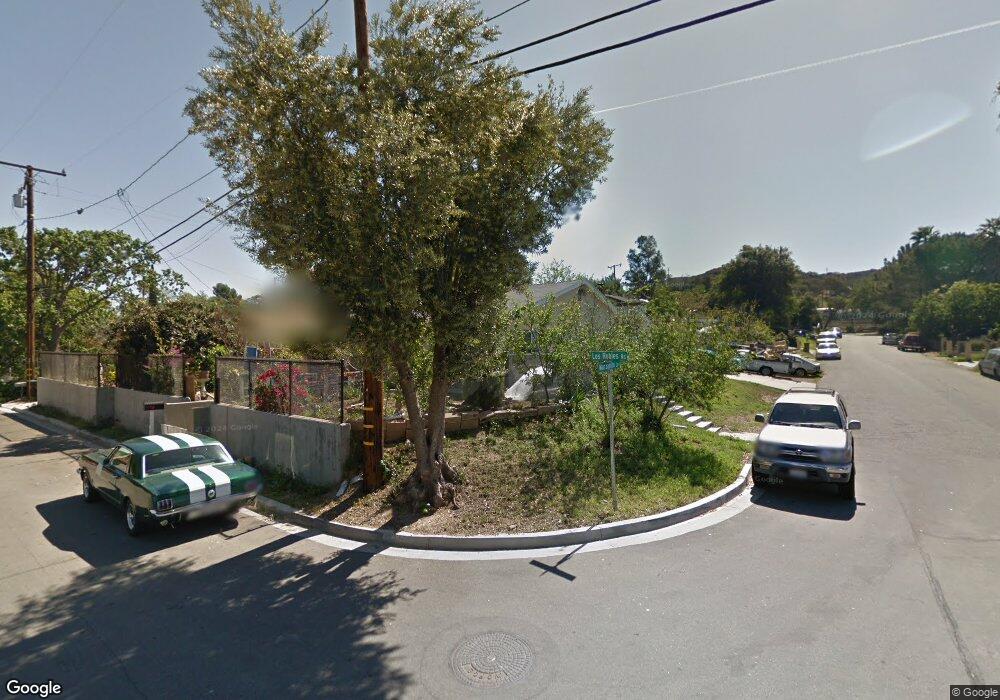
2902 Los Robles Rd Thousand Oaks, CA 91362
Estimated Value: $683,000 - $1,127,000
4
Beds
2
Baths
1,192
Sq Ft
$683/Sq Ft
Est. Value
About This Home
This home is located at 2902 Los Robles Rd, Thousand Oaks, CA 91362 and is currently estimated at $814,226, approximately $683 per square foot. 2902 Los Robles Rd is a home located in Ventura County with nearby schools including Conejo Elementary School, Colina Middle School, and Westlake High School.
Ownership History
Date
Name
Owned For
Owner Type
Purchase Details
Closed on
Dec 19, 2003
Sold by
Suruy Heidi L
Bought by
Mejia Mario S and Mejia Maria
Current Estimated Value
Home Financials for this Owner
Home Financials are based on the most recent Mortgage that was taken out on this home.
Original Mortgage
$247,500
Outstanding Balance
$121,604
Interest Rate
6.75%
Mortgage Type
Purchase Money Mortgage
Estimated Equity
$692,622
Purchase Details
Closed on
May 21, 2001
Sold by
Williams Ruth
Bought by
Mejia Mario S and Mejia Maria
Home Financials for this Owner
Home Financials are based on the most recent Mortgage that was taken out on this home.
Original Mortgage
$133,450
Interest Rate
7.09%
Purchase Details
Closed on
Jan 12, 1997
Sold by
Walters Samuel
Bought by
Williams Ruth
Purchase Details
Closed on
Jan 5, 1995
Sold by
Walters Samuel and Walters Sam
Bought by
Walters Samuel
Create a Home Valuation Report for This Property
The Home Valuation Report is an in-depth analysis detailing your home's value as well as a comparison with similar homes in the area
Purchase History
| Date | Buyer | Sale Price | Title Company |
|---|---|---|---|
| Mejia Mario S | $82,500 | Investors Title Company | |
| Mejia Mario S | $140,500 | Investors Title Company | |
| Williams Ruth | -- | -- | |
| Walters Samuel | -- | -- |
Source: Public Records
Mortgage History
| Date | Status | Borrower | Loan Amount |
|---|---|---|---|
| Open | Mejia Mario S | $247,500 | |
| Previous Owner | Mejia Mario S | $133,450 |
Source: Public Records
Tax History
| Year | Tax Paid | Tax Assessment Tax Assessment Total Assessment is a certain percentage of the fair market value that is determined by local assessors to be the total taxable value of land and additions on the property. | Land | Improvement |
|---|---|---|---|---|
| 2025 | $7,934 | $382,516 | $295,002 | $87,514 |
| 2024 | $7,934 | $375,016 | $289,217 | $85,799 |
| 2023 | $7,791 | $367,663 | $283,546 | $84,117 |
| 2022 | $7,693 | $360,454 | $277,986 | $82,468 |
| 2021 | $7,619 | $353,387 | $272,536 | $80,851 |
| 2020 | $7,210 | $349,766 | $269,743 | $80,023 |
| 2019 | $7,112 | $342,908 | $264,454 | $78,454 |
| 2018 | $7,039 | $336,185 | $259,269 | $76,916 |
| 2017 | $6,969 | $329,594 | $254,186 | $75,408 |
| 2016 | $6,937 | $323,132 | $249,202 | $73,930 |
| 2015 | $3,431 | $318,279 | $245,459 | $72,820 |
| 2014 | $3,309 | $305,000 | $236,000 | $69,000 |
Source: Public Records
Map
Nearby Homes
- 107 Fairview Rd
- 0 S Skyline Dr Unit V1-32897
- 0 S Skyline Dr Unit PW24235911
- 2598 Thunderbird Dr Unit 22
- 272 Manzanita Ln
- 251 S Skyline Dr
- 3010 Foothill Dr
- 2486 Pleasant Way Unit H
- 2456 Pleasant Way Unit A
- 3308 Sawtooth Ct
- 3388 Holly Grove St
- 364 Eric Place
- 3091 E Hillcrest Dr
- 378 Westlake Vista Ln
- 2417 E Hillcrest Dr
- 3316 Medicine Bow Ct
- 327 Wynn Ct
- 2193 Los Feliz Dr Unit 6
- 295 Toyon Ct
- 315 E Toyon Ct
- 2916 Los Robles Rd
- 2926 Los Robles Rd
- 130 Manzanita Ln
- 2874 Los Robles Rd
- 2940 Los Robles Rd
- 2862 Los Robles Rd
- 131 Manzanita Ln
- 131 Yucca Ln
- 140 Manzanita Ln
- 141 Manzanita Ln
- 2947 Los Robles Rd
- 2850 Los Robles Rd
- 141 Yucca Ln
- 161 Manzanita Ln
- 2826 Los Robles Rd
- 2949 Los Robles Rd
- 130 S Skyline Dr
- 2967 Los Robles Rd
- 2990 Los Robles Rd
- 140 S Skyline Dr
Your Personal Tour Guide
Ask me questions while you tour the home.