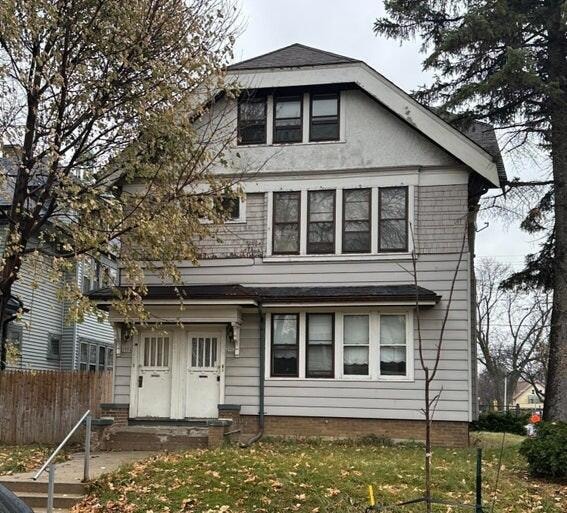
2902 N 44th St Unit 2904 Milwaukee, WI 53210
Saint Joseph NeighborhoodEstimated payment $1,160/month
About This Home
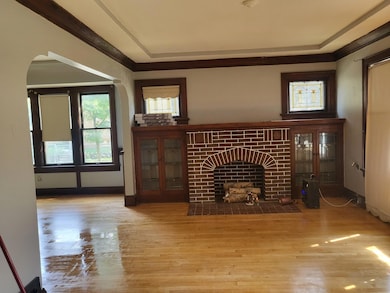
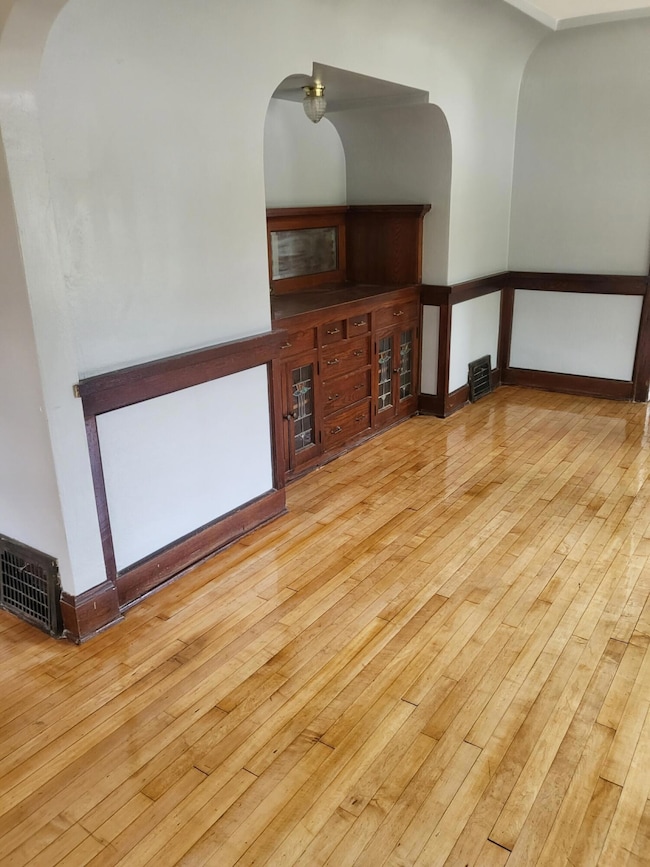
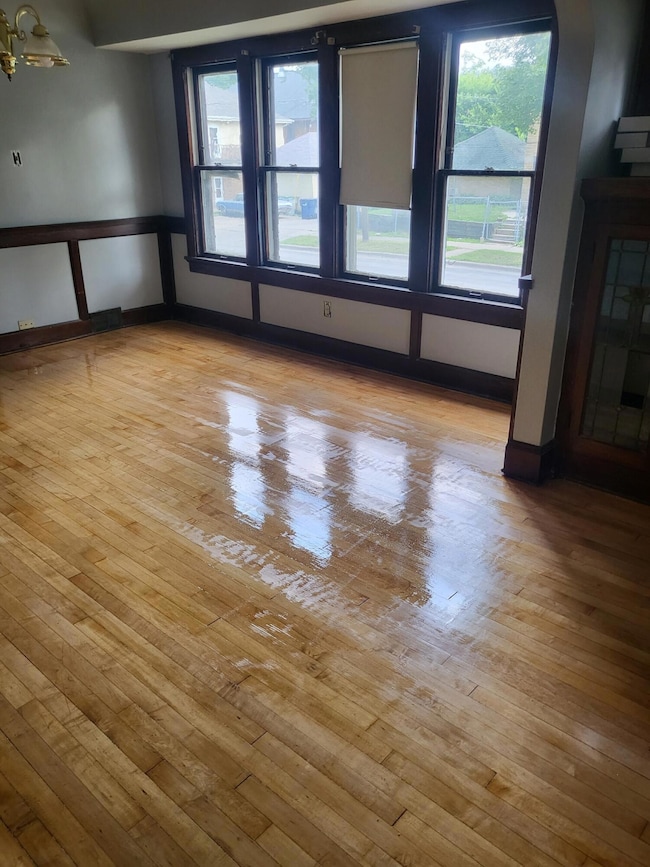
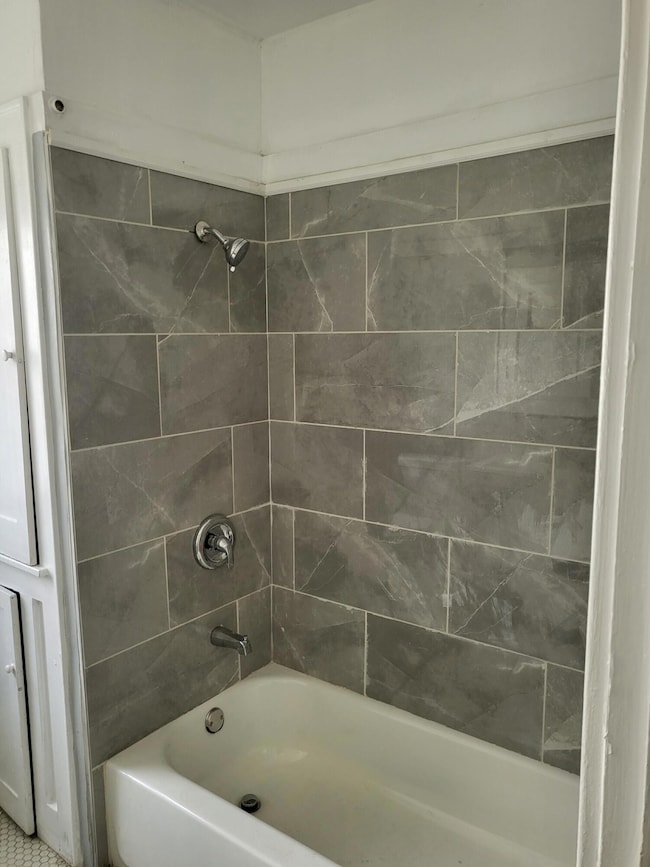
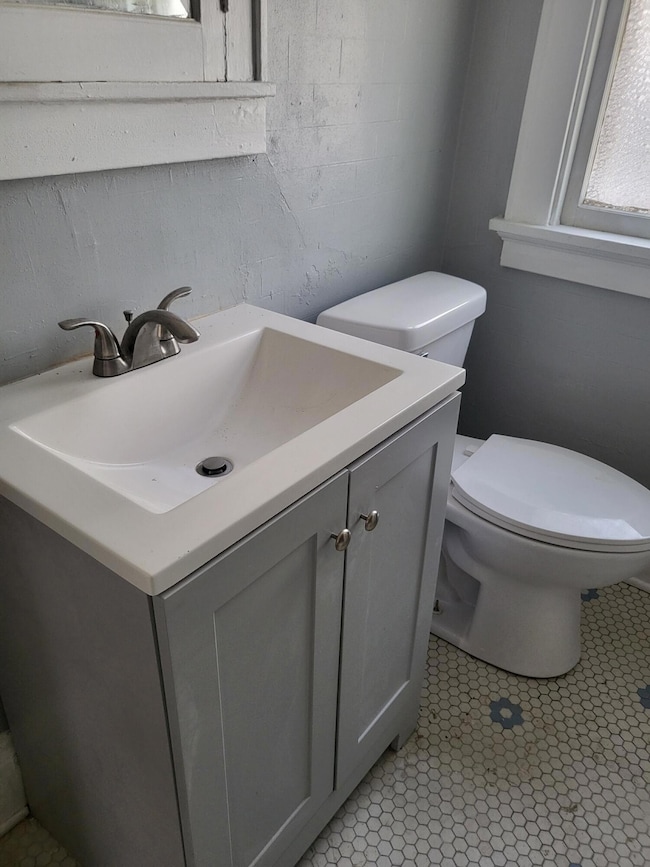
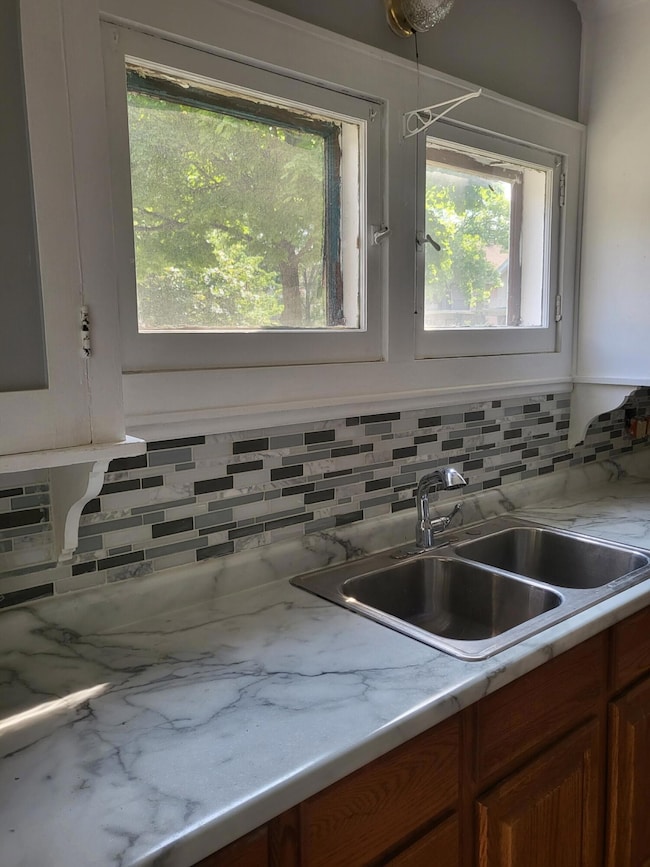
Great investment or owner-occupant opportunity! This spacious 2/2 duplex offers solid rental income with both units rented MTM for $900 and $925. Features include updated kitchens and baths, hardwood floors, built-in cabinets, and artificial fireplaces. The finished 3rd floor adds a kitchen, bath, bedroom, and living roomideal for combining with the upper unit for a large 3BR/2BA layout. New roof, fenced yard, and detached garage. Exterior needs some TLC. Schedule your showing today!
Property Details
Home Type
- Multi-Family
Est. Annual Taxes
- $3,461
Lot Details
- 4,792 Sq Ft Lot
Home Design
- Vinyl Siding
Interior Spaces
- 3,164 Sq Ft Home
- Basement Fills Entire Space Under The House
Community Details
- Operating Expense $6,000
- Net Operating Income $22,500
Listing and Financial Details
- Assessor Parcel Number 3070115000
Map
Home Values in the Area
Average Home Value in this Area
Tax History
| Year | Tax Paid | Tax Assessment Tax Assessment Total Assessment is a certain percentage of the fair market value that is determined by local assessors to be the total taxable value of land and additions on the property. | Land | Improvement |
|---|---|---|---|---|
| 2024 | $3,461 | $107,900 | $7,000 | $100,900 |
| 2023 | $2,082 | $88,100 | $7,000 | $81,100 |
| 2022 | $4,805 | $88,100 | $7,000 | $81,100 |
| 2021 | $6,039 | $88,300 | $7,000 | $81,300 |
| 2020 | $4,172 | $88,300 | $7,000 | $81,300 |
| 2019 | $3,820 | $64,000 | $7,000 | $57,000 |
| 2018 | $3,566 | $64,000 | $7,000 | $57,000 |
| 2017 | $3,833 | $61,000 | $5,800 | $55,200 |
| 2016 | $4,026 | $60,500 | $5,800 | $54,700 |
| 2015 | -- | $63,700 | $5,800 | $57,900 |
| 2014 | -- | $70,800 | $5,800 | $65,000 |
| 2013 | -- | $78,700 | $5,800 | $72,900 |
Property History
| Date | Event | Price | List to Sale | Price per Sq Ft |
|---|---|---|---|---|
| 10/31/2025 10/31/25 | For Sale | $165,000 | +60.2% | $52 / Sq Ft |
| 05/07/2023 05/07/23 | Off Market | $103,000 | -- | -- |
| 03/09/2023 03/09/23 | Pending | -- | -- | -- |
| 12/21/2022 12/21/22 | Price Changed | $103,000 | -14.2% | $33 / Sq Ft |
| 12/01/2022 12/01/22 | For Sale | $120,000 | -- | $38 / Sq Ft |
Purchase History
| Date | Type | Sale Price | Title Company |
|---|---|---|---|
| Warranty Deed | $95,000 | None Listed On Document | |
| Sheriffs Deed | $99,098 | -- |
Mortgage History
| Date | Status | Loan Amount | Loan Type |
|---|---|---|---|
| Open | $126,900 | Construction |
Source: Metro MLS
MLS Number: 1941375
APN: 307-0115-000-3
Disclaimer: Certain information contained herein is derived from information provided by parties other than Homes.com. All information provided is deemed reliable, but is not guaranteed to be accurate and should be independently verified.
![]() IDX information is provided exclusively for personal, non-commercial use, and may not be used for any purpose other than to identify prospective properties consumers may be interested in purchasing.
IDX information is provided exclusively for personal, non-commercial use, and may not be used for any purpose other than to identify prospective properties consumers may be interested in purchasing.
IDX listing data provided by Multiple Listing Service, Inc. Information is supplied by seller and other third parties and has not been verified.
Copyright 2025 – Multiple Listing Service, Inc. – All Rights Reserved.
- 2932 N 44th St Unit 2934
- 2954 N 45th St Unit 2956
- 2770 N 44th St Unit 2772
- 2754 N 44th St Unit 2756
- 2748 N 44th St Unit 2750
- 2834 N 47th St Unit 2836
- 2919 N 47th St Unit 2921
- 2722 N 45th St Unit 2724
- 4404 W Burleigh St
- 3108 N 44th St
- 2771 N 40th St Unit 2773
- 3130 N 44th St
- 3030 N 48th St
- 2661 N 44th St
- 3002 N 40th St Unit 3004
- 3132 N 42nd St
- 2745 N 48th St Unit 2747
- 2761 N 39th St Unit 2763
- 2956 N 39th St
- 4018 W Burleigh St
- 2853 N Sherman Blvd Unit 2
- 3155 N 42nd St
- 2574 N 41st St
- 2572 N 41st St
- 2608 N 40th St Unit 2608a
- 3208 N 48th St Unit 3208
- 2776 N 53rd St Unit Upper
- 3412 W Fond du Lac Ave
- 2575 N 34th St Unit Upper
- 2325 N 50th St
- 2975 N 58th St Unit 2975 Upper
- 4572 W Fond du Lac Ave
- 2238 N 55th St
- 2800 W Wright St
- 3326 N 29th St Unit 3326 N 29th st. LOWER
- 3940 W Lisbon Ave
- 2481 W Locust St
- 2057 N 32nd St
- 2478 W Chambers St
- 2219 N 29th St Unit 2219a
