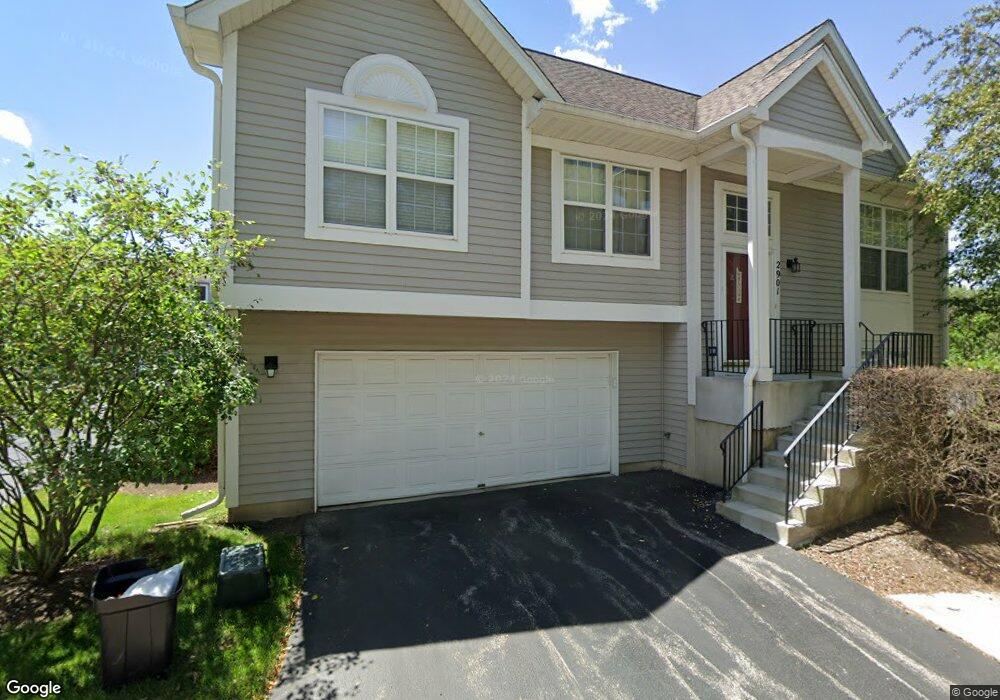
2903 Shelly Ln Aurora, IL 60504
Waubonsie NeighborhoodEstimated Value: $240,000 - $264,000
2
Beds
2
Baths
944
Sq Ft
$262/Sq Ft
Est. Value
About This Home
This home is located at 2903 Shelly Ln, Aurora, IL 60504 and is currently estimated at $247,717, approximately $262 per square foot. 2903 Shelly Ln is a home located in DuPage County with nearby schools including McCarty Elementary School, Fischer Middle School, and Waubonsie Valley High School.
Ownership History
Date
Name
Owned For
Owner Type
Purchase Details
Closed on
Sep 11, 2017
Sold by
King Anne E
Bought by
Skerjan Michael
Current Estimated Value
Home Financials for this Owner
Home Financials are based on the most recent Mortgage that was taken out on this home.
Original Mortgage
$118,400
Outstanding Balance
$99,137
Interest Rate
4%
Mortgage Type
New Conventional
Estimated Equity
$148,580
Purchase Details
Closed on
Aug 22, 2003
Sold by
Moses Timothy A
Bought by
King Anne E
Home Financials for this Owner
Home Financials are based on the most recent Mortgage that was taken out on this home.
Original Mortgage
$108,800
Interest Rate
4.12%
Mortgage Type
Purchase Money Mortgage
Purchase Details
Closed on
Jul 31, 1995
Sold by
First Bank & Trust Company Of Illinois
Bought by
Moses Timothy A
Home Financials for this Owner
Home Financials are based on the most recent Mortgage that was taken out on this home.
Original Mortgage
$101,534
Interest Rate
7.76%
Mortgage Type
FHA
Create a Home Valuation Report for This Property
The Home Valuation Report is an in-depth analysis detailing your home's value as well as a comparison with similar homes in the area
Home Values in the Area
Average Home Value in this Area
Purchase History
| Date | Buyer | Sale Price | Title Company |
|---|---|---|---|
| Skerjan Michael | $148,000 | First American Title Insuran | |
| King Anne E | $136,000 | Multiple | |
| Moses Timothy A | $104,500 | -- |
Source: Public Records
Mortgage History
| Date | Status | Borrower | Loan Amount |
|---|---|---|---|
| Open | Skerjan Michael | $118,400 | |
| Previous Owner | King Anne E | $108,800 | |
| Previous Owner | Moses Timothy A | $101,534 | |
| Closed | King Anne E | $13,550 |
Source: Public Records
Tax History Compared to Growth
Tax History
| Year | Tax Paid | Tax Assessment Tax Assessment Total Assessment is a certain percentage of the fair market value that is determined by local assessors to be the total taxable value of land and additions on the property. | Land | Improvement |
|---|---|---|---|---|
| 2024 | $3,730 | $57,059 | $14,891 | $42,168 |
| 2023 | $3,517 | $51,270 | $13,380 | $37,890 |
| 2022 | $3,397 | $46,510 | $12,040 | $34,470 |
| 2021 | $3,296 | $44,850 | $11,610 | $33,240 |
| 2020 | $3,336 | $44,850 | $11,610 | $33,240 |
| 2019 | $3,202 | $42,650 | $11,040 | $31,610 |
| 2018 | $2,376 | $32,900 | $8,700 | $24,200 |
| 2017 | $2,323 | $31,780 | $8,400 | $23,380 |
| 2016 | $2,105 | $28,770 | $7,600 | $21,170 |
| 2015 | $2,062 | $27,320 | $7,220 | $20,100 |
| 2014 | $2,012 | $26,190 | $6,930 | $19,260 |
| 2013 | $1,994 | $26,370 | $6,980 | $19,390 |
Source: Public Records
Map
Nearby Homes
- 2901 Shelly Ln
- 2950 Shelly Ln Unit 2950
- 2750 Shelly Ln
- 3140 Medford Ct
- 3132 Portland Ct
- 3357 Ravinia Cir
- 3131 Portland Ct
- 2476 Village Ct Unit 2
- 1335 Lawrence Ct
- 441 Park Ridge Ln Unit C
- 164 Park Ridge Ln
- 308 Foxworth Ct
- 2297 Lakeside Dr Unit 10
- 1465 Bridgeport Ln Unit 19D
- 295 Meadowview Ln
- 72 Heather Glen Dr Unit 72
- 3467 Charlemaine Dr
- 205 Churchill Ln
- 2860 Bridgeport Ln Unit 19D
- 3479 Charlemaine Dr
- 2905 Shelly Ln
- 2907 Shelly Ln
- 2909 Shelly Ln
- 2909 Shelly Ln Unit 2909
- 2931 Shelly Ln
- 2933 Shelly Ln
- 2894 Shelly Ln
- 2894 Shelly Ln Unit 2894
- 2935 Shelly Ln
- 2896 Shelly Ln
- 2892 Shelly Ln
- 2898 Shelly Ln
- 2890 Shelly Ln
- 2915 Shelly Ln
- 2913 Shelly Ln
- 2913 Shelly Ln Unit 2913
- 2869 Shelly Ln
- 2917 Shelly Ln
- 2937 Shelly Ln
- 2911 Shelly Ln