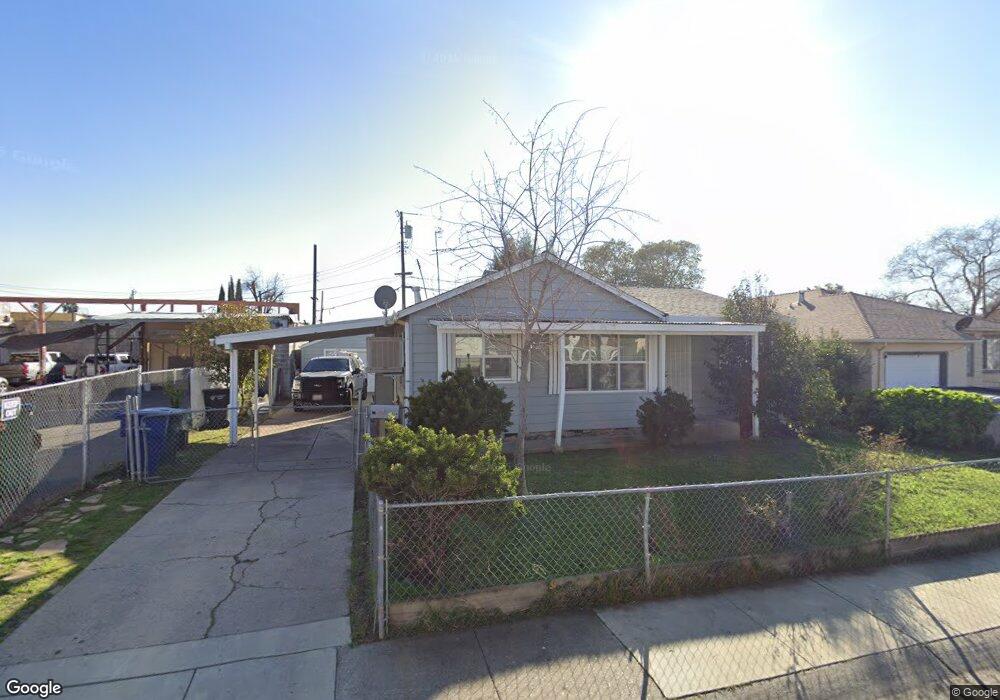
2904 16th Ave Sacramento, CA 95820
North City Farms NeighborhoodEstimated Value: $292,767 - $372,000
2
Beds
1
Bath
832
Sq Ft
$404/Sq Ft
Est. Value
About This Home
This home is located at 2904 16th Ave, Sacramento, CA 95820 and is currently estimated at $335,942, approximately $403 per square foot. 2904 16th Ave is a home located in Sacramento County with nearby schools including Ethel Phillips Elementary School, California Middle, and C. K. McClatchy High.
Ownership History
Date
Name
Owned For
Owner Type
Purchase Details
Closed on
May 4, 2018
Sold by
Reinhardt Richard G
Bought by
Richard G Reinhardt Trust and Reinhardt
Current Estimated Value
Purchase Details
Closed on
May 4, 2011
Sold by
Jackson Stephen and Reinhardt Richard G
Bought by
Reinhardt Richard G
Purchase Details
Closed on
Mar 21, 2008
Sold by
Jackson Veda
Bought by
Jackson Veda and Veda Jackson 2008 Revocable Tr
Create a Home Valuation Report for This Property
The Home Valuation Report is an in-depth analysis detailing your home's value as well as a comparison with similar homes in the area
Home Values in the Area
Average Home Value in this Area
Purchase History
| Date | Buyer | Sale Price | Title Company |
|---|---|---|---|
| Richard G Reinhardt Trust | -- | None Listed On Document | |
| Richard G Reinhardt Trust | -- | None Listed On Document | |
| Reinhardt Richard G | -- | None Available | |
| Jackson Veda | -- | None Available |
Source: Public Records
Tax History
| Year | Tax Paid | Tax Assessment Tax Assessment Total Assessment is a certain percentage of the fair market value that is determined by local assessors to be the total taxable value of land and additions on the property. | Land | Improvement |
|---|---|---|---|---|
| 2025 | $962 | $67,436 | $13,033 | $54,403 |
| 2024 | $962 | $66,115 | $12,778 | $53,337 |
| 2023 | $939 | $64,820 | $12,528 | $52,292 |
| 2022 | $922 | $63,550 | $12,283 | $51,267 |
| 2021 | $881 | $62,305 | $12,043 | $50,262 |
| 2020 | $884 | $61,667 | $11,920 | $49,747 |
| 2019 | $866 | $60,459 | $11,687 | $48,772 |
| 2018 | $852 | $59,274 | $11,458 | $47,816 |
| 2017 | $839 | $58,113 | $11,234 | $46,879 |
| 2016 | $786 | $56,974 | $11,014 | $45,960 |
| 2015 | $773 | $56,119 | $10,849 | $45,270 |
| 2014 | $755 | $55,021 | $10,637 | $44,384 |
Source: Public Records
Map
Nearby Homes
Your Personal Tour Guide
Ask me questions while you tour the home.