2904 Acton St Berkeley, CA 94702
West Berkeley NeighborhoodEstimated Value: $936,474 - $1,182,000
2
Beds
1
Bath
1,224
Sq Ft
$887/Sq Ft
Est. Value
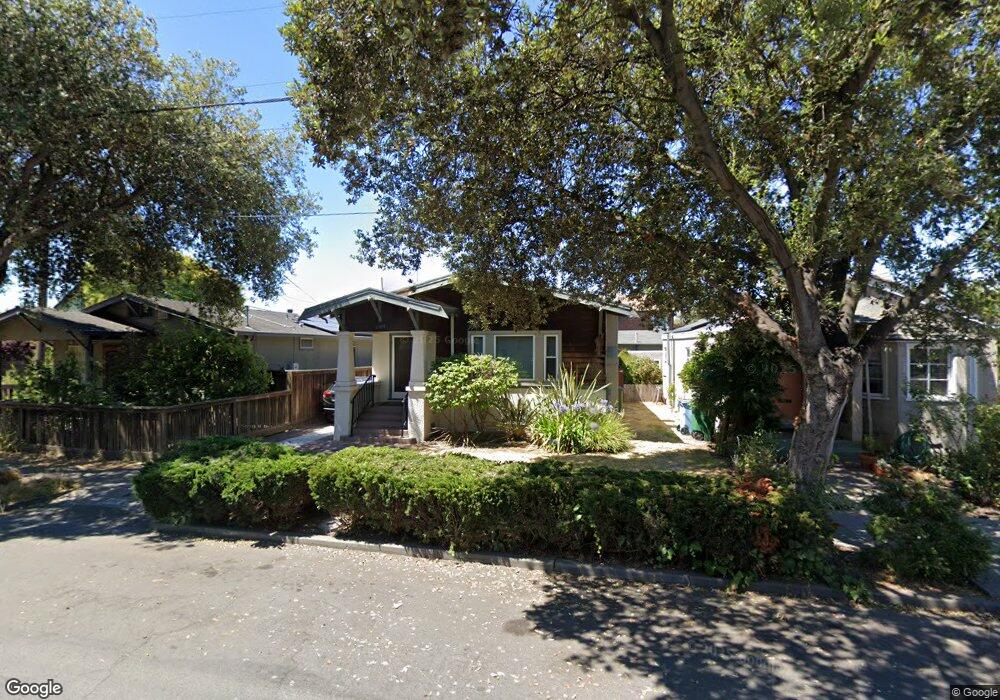
About This Home
This home is located at 2904 Acton St, Berkeley, CA 94702 and is currently estimated at $1,086,119, approximately $887 per square foot. 2904 Acton St is a home located in Alameda County with nearby schools including Malcolm X Elementary School, Washington Elementary School, and Oxford Elementary School.
Ownership History
Date
Name
Owned For
Owner Type
Purchase Details
Closed on
Oct 14, 2002
Sold by
Taylor Bobbie L
Bought by
Taylor Earnest
Current Estimated Value
Home Financials for this Owner
Home Financials are based on the most recent Mortgage that was taken out on this home.
Original Mortgage
$300,000
Interest Rate
4.87%
Create a Home Valuation Report for This Property
The Home Valuation Report is an in-depth analysis detailing your home's value as well as a comparison with similar homes in the area
Home Values in the Area
Average Home Value in this Area
Purchase History
| Date | Buyer | Sale Price | Title Company |
|---|---|---|---|
| Taylor Earnest | -- | Fidelity National Title |
Source: Public Records
Mortgage History
| Date | Status | Borrower | Loan Amount |
|---|---|---|---|
| Closed | Taylor Earnest | $300,000 |
Source: Public Records
Tax History
| Year | Tax Paid | Tax Assessment Tax Assessment Total Assessment is a certain percentage of the fair market value that is determined by local assessors to be the total taxable value of land and additions on the property. | Land | Improvement |
|---|---|---|---|---|
| 2025 | $4,202 | $52,121 | $27,702 | $31,419 |
| 2024 | $4,202 | $50,962 | $27,159 | $30,803 |
| 2023 | $4,035 | $56,826 | $26,627 | $30,199 |
| 2022 | $4,061 | $48,712 | $26,105 | $29,607 |
| 2021 | $4,037 | $47,619 | $25,593 | $29,026 |
| 2020 | $3,743 | $54,059 | $25,330 | $28,729 |
| 2019 | $3,489 | $52,999 | $24,834 | $28,165 |
| 2018 | $3,363 | $51,960 | $24,347 | $27,613 |
| 2017 | $3,224 | $51,294 | $23,870 | $27,424 |
| 2016 | $3,008 | $49,943 | $23,402 | $26,541 |
| 2015 | $2,937 | $49,192 | $23,050 | $26,142 |
| 2014 | $2,857 | $48,229 | $22,599 | $25,630 |
Source: Public Records
Map
Nearby Homes
- 2922 Stanton St
- 1314 Ashby Ave
- 3032 Mabel St
- 1237 Ashby Ave
- 1535 Julia St
- 1507 Prince St
- 2790 Sacramento St
- 3101 Sacramento St
- 2782 Sacramento St
- 2774 Sacramento St
- 2758 Sacramento St
- 1450 Ward St
- 1530 Stuart St
- 1080 67th St
- 2750 Sacramento St
- 2751 Wallace St
- 6628 Helen Ct
- 3110 California St
- 3114 California St
- 2747 San Pablo Ave Unit 507
Your Personal Tour Guide
Ask me questions while you tour the home.