2904 Benevolence Dr Unit Lot 00.0215 Raleigh, NC 27610
South Raleigh NeighborhoodEstimated Value: $286,000 - $332,000
3
Beds
3
Baths
1,598
Sq Ft
$188/Sq Ft
Est. Value
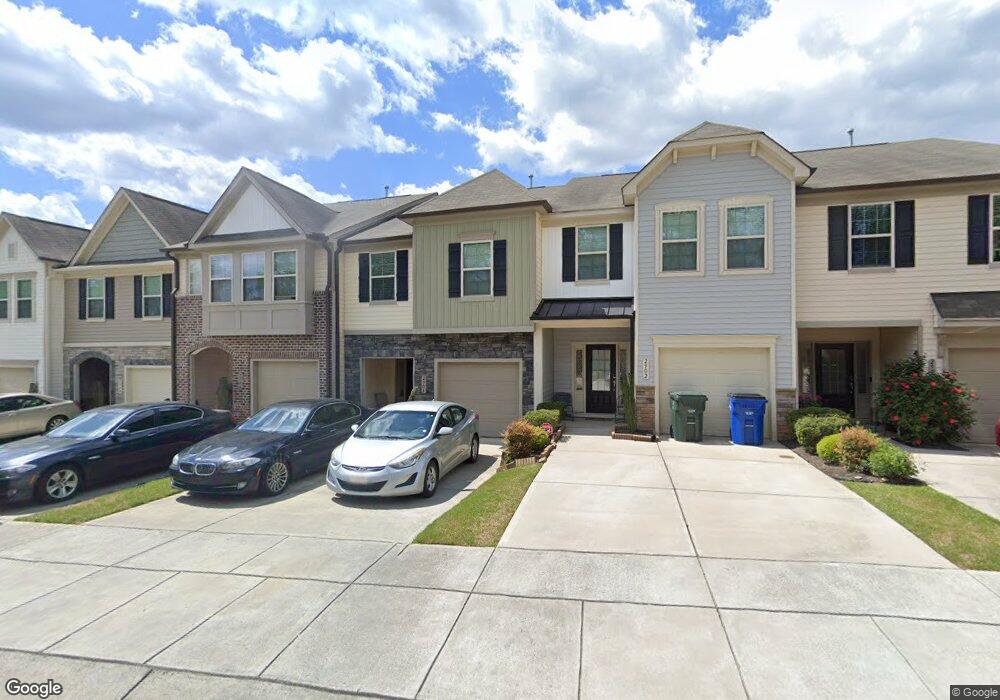
About This Home
This home is located at 2904 Benevolence Dr Unit Lot 00.0215, Raleigh, NC 27610 and is currently estimated at $300,920, approximately $188 per square foot. 2904 Benevolence Dr Unit Lot 00.0215 is a home located in Wake County with nearby schools including Walnut Creek Elementary School, Carnage Magnet Middle School, and Southeast Raleigh Magnet High School.
Ownership History
Date
Name
Owned For
Owner Type
Purchase Details
Closed on
Aug 5, 2024
Sold by
Currey Karen
Bought by
Rahman Raisa
Current Estimated Value
Home Financials for this Owner
Home Financials are based on the most recent Mortgage that was taken out on this home.
Original Mortgage
$225,000
Outstanding Balance
$222,493
Interest Rate
6.95%
Mortgage Type
New Conventional
Estimated Equity
$78,427
Purchase Details
Closed on
May 24, 2016
Sold by
Dan Ryan Builders North Carolina Llc
Bought by
Currey Karen
Home Financials for this Owner
Home Financials are based on the most recent Mortgage that was taken out on this home.
Original Mortgage
$135,303
Interest Rate
3.59%
Mortgage Type
New Conventional
Create a Home Valuation Report for This Property
The Home Valuation Report is an in-depth analysis detailing your home's value as well as a comparison with similar homes in the area
Home Values in the Area
Average Home Value in this Area
Purchase History
| Date | Buyer | Sale Price | Title Company |
|---|---|---|---|
| Rahman Raisa | $300,000 | None Listed On Document | |
| Currey Karen | $150,500 | None Available |
Source: Public Records
Mortgage History
| Date | Status | Borrower | Loan Amount |
|---|---|---|---|
| Open | Rahman Raisa | $225,000 | |
| Previous Owner | Currey Karen | $135,303 |
Source: Public Records
Tax History Compared to Growth
Tax History
| Year | Tax Paid | Tax Assessment Tax Assessment Total Assessment is a certain percentage of the fair market value that is determined by local assessors to be the total taxable value of land and additions on the property. | Land | Improvement |
|---|---|---|---|---|
| 2025 | $2,603 | $296,128 | $55,000 | $241,128 |
| 2024 | $2,592 | $296,128 | $55,000 | $241,128 |
| 2023 | $1,995 | $181,207 | $28,000 | $153,207 |
| 2022 | $1,855 | $181,207 | $28,000 | $153,207 |
| 2021 | $1,783 | $181,207 | $28,000 | $153,207 |
| 2020 | $1,751 | $181,207 | $28,000 | $153,207 |
| 2019 | $1,667 | $142,132 | $28,000 | $114,132 |
| 2018 | $1,573 | $142,132 | $28,000 | $114,132 |
| 2017 | $1,499 | $142,132 | $28,000 | $114,132 |
| 2016 | $285 | $28,000 | $28,000 | $0 |
| 2015 | $259 | $25,000 | $25,000 | $0 |
Source: Public Records
Map
Nearby Homes
- 2911 Benevolence Dr
- 2403 Savior St
- 2518 Shepherd Valley St
- 3604 Rivermist Dr
- 2756 Shepherd Valley St
- 3445 Dutchman Rd
- 2424 Shepherd Valley St
- 3705 Rivermist Dr
- 3030 Rock Quarry Rd
- 3140 Slippery Elm Dr
- 2816 Smoke Place
- 2414 Quarry Ridge Ln
- 2109 Star Sapphire Dr
- 3513 Diamond Springs Dr
- 2908 Basswood Dr
- 3101 Rendezvous Dr
- 4105 Crowfield Dr
- 2704 Hope Diamond Ct
- 3101 Riverbrooke Dr
- 4312 Viewmont Dr
- 2904 Benevolence Dr
- 2904 Benevolence Dr
- 2906 Benevolence Dr Unit LOT 00.0214
- 2906 Benevolence Dr
- 2902 Benevolence Dr Unit Lot 00.0216
- 2902 Benevolence Dr
- 2908 Benevolence Dr Unit LOT 00.0213
- 2908 Benevolence Dr
- 2900 Benevolence Dr Unit Lot 00.0217
- 2900 Benevolence Dr
- 2910 Benevolence Dr Unit LOT 00.0212
- 2910 Benevolence Dr
- 2810 Benevolence Dr Unit Lot 00.0218
- 2810 Benevolence Dr
- 2808 Benevolence Dr Unit LOT 00.0219
- 2808 Benevolence Dr
- 2806 Benevolence Dr Unit Lot 00.0220
- 2907 Benevolence Dr
- 2804 Benevolence Dr Unit Lot 00.0221
- 2905 Benevolence Dr Unit LOT 00.0208