
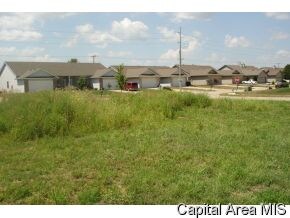
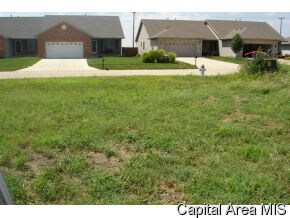


2904 Cindy Ln Springfield, IL 62711
Cobblestone Estates NeighborhoodAbout This Lot
As of September 2014STILL SPECIAL DEALS FOR MULTIPLE LOT SALES. Applies for builders or home buyers. This is from the Starwood Courts Development (within Cobblestone area). Great place to build and easy access to interstates/shopping and more!Westside
Last Buyer's Agent
WILLIAM BREDEMEYER
IN BETWEEN OFFICES License #475149336
Property Details
Property Type
- Land
Est. Annual Taxes
- $1,127
Schools
- Springfield District #186 High School
Map
Home Values in the Area
Average Home Value in this Area
Property History
| Date | Event | Price | Change | Sq Ft Price |
|---|---|---|---|---|
| 09/30/2014 09/30/14 | Sold | $185,000 | -4.1% | $116 / Sq Ft |
| 09/12/2014 09/12/14 | Pending | -- | -- | -- |
| 08/19/2014 08/19/14 | For Sale | $192,900 | +7.2% | $121 / Sq Ft |
| 07/29/2013 07/29/13 | Sold | $180,000 | -2.7% | $113 / Sq Ft |
| 06/26/2013 06/26/13 | Pending | -- | -- | -- |
| 08/15/2012 08/15/12 | For Sale | $185,000 | +428.6% | $116 / Sq Ft |
| 03/23/2012 03/23/12 | Sold | $35,000 | -22.0% | -- |
| 02/22/2012 02/22/12 | Pending | -- | -- | -- |
| 02/16/2010 02/16/10 | For Sale | $44,900 | -- | -- |
Tax History
| Year | Tax Paid | Tax Assessment Tax Assessment Total Assessment is a certain percentage of the fair market value that is determined by local assessors to be the total taxable value of land and additions on the property. | Land | Improvement |
|---|---|---|---|---|
| 2023 | $5,815 | $72,771 | $7,548 | $65,223 |
| 2022 | $5,528 | $68,633 | $7,160 | $61,473 |
| 2021 | $5,326 | $66,063 | $6,892 | $59,171 |
| 2020 | $5,221 | $66,162 | $6,902 | $59,260 |
| 2019 | $5,123 | $65,931 | $6,878 | $59,053 |
| 2018 | $4,394 | $58,778 | $6,845 | $51,933 |
| 2017 | $4,297 | $58,017 | $6,756 | $51,261 |
| 2016 | $4,206 | $57,170 | $6,657 | $50,513 |
| 2015 | $4,159 | $56,486 | $6,577 | $49,909 |
| 2014 | $3,901 | $56,122 | $6,535 | $49,587 |
| 2013 | $2,110 | $28,990 | $6,535 | $22,455 |
Deed History
| Date | Type | Sale Price | Title Company |
|---|---|---|---|
| Deed | -- | -- | |
| Deed | $185,000 | -- | |
| Deed | $180,000 | -- | |
| Deed | -- | -- |
Source: RMLS Alliance
MLS Number: RMACA100808
APN: 21-11.0-402-020
Disclaimer: Certain information contained herein is derived from information provided by parties other than Homes.com. All information provided is deemed reliable, but is not guaranteed to be accurate and should be independently verified.
![]() IDX information is provided exclusively for personal, non-commercial use, and may not be used for any purpose other than to identify prospective properties consumers may be interested in purchasing. Information is deemed reliable but not guaranteed.
IDX information is provided exclusively for personal, non-commercial use, and may not be used for any purpose other than to identify prospective properties consumers may be interested in purchasing. Information is deemed reliable but not guaranteed.
- 2919 S Meadowbrook Rd Unit 13
- 2811 Haggard Dr
- 12B Westgate Dr
- 12A Westgate Dr
- 11B Westgate Dr
- 11A Westgate Dr
- 10B Westgate Dr
- 10A Westgate Dr
- 9B Westgate Dr
- 9A Westgate Dr
- 5904 Hedley Rd
- 6013 Hedley Rd
- 3700 Westgate Dr
- Lots 4-7 Yucan & Mercantile Dr
- 4204 Lavender Ln
- 3540 Sandwood Dr
- 3400 Ginger Creek Dr
- 713 Sloan Dr
- 5212 Verdant Ln
- 2866 Reseda Rd