2904 Doyle Ave Columbus, GA 31907
East Columbus NeighborhoodAbout This Home
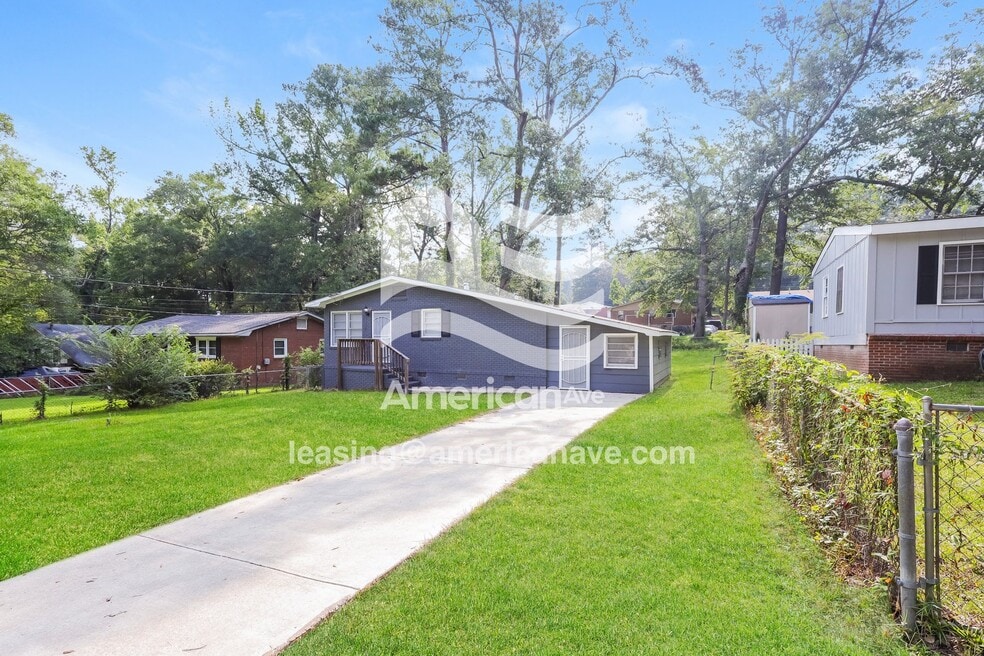
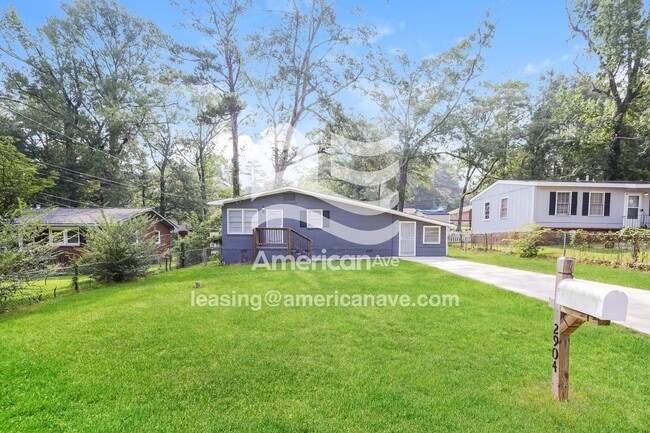
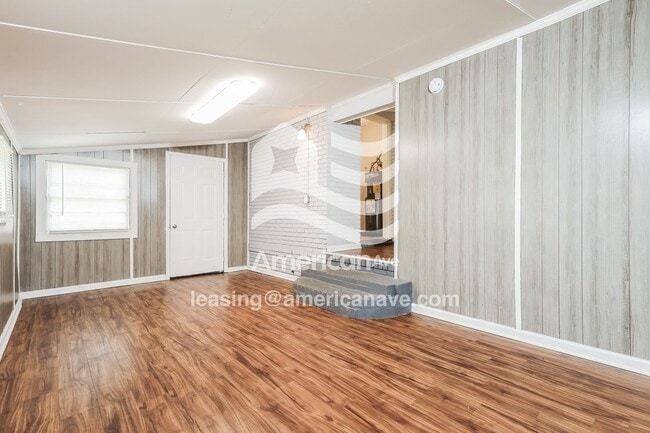
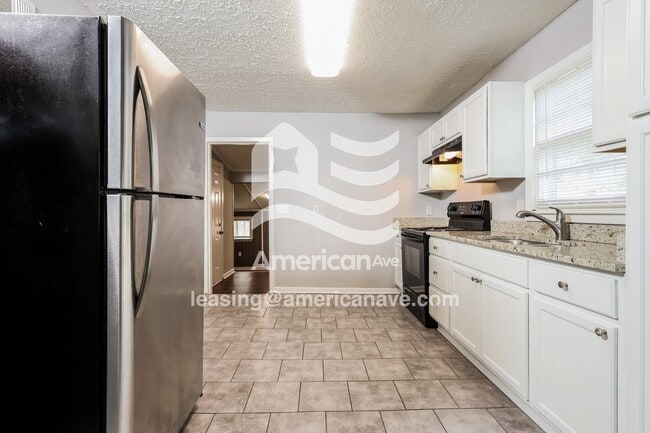
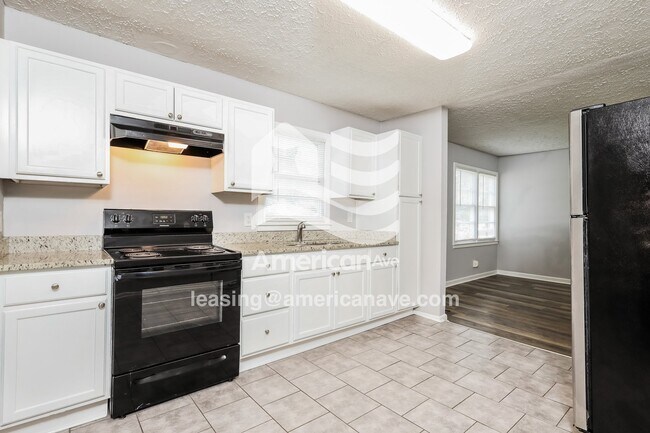
Welcome to your recently-updated 3-bedroom, 2-bath home on Doyle Ave in the East Urban Hgts subdivision of Columbus.
We are pet-friendly! Your dogs and cats are welcome at 2904 Doyle Avenue.
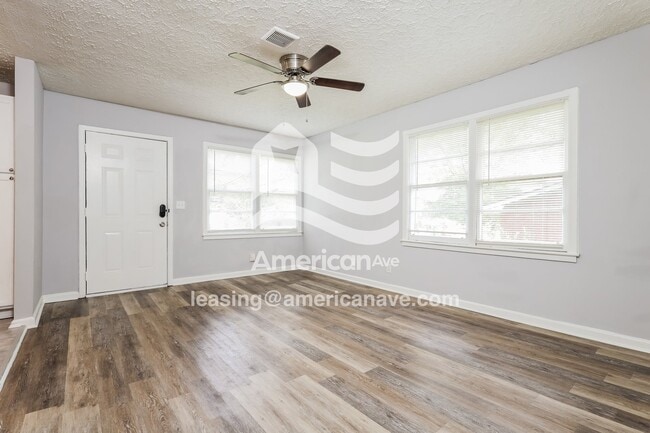
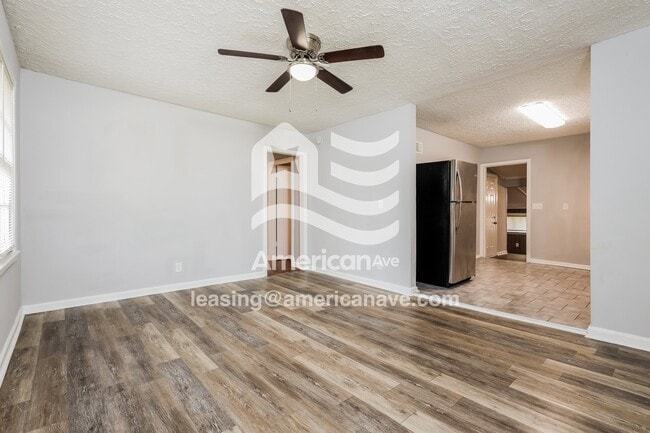
This home's recent remodel creates a contemporary and pleasant atmosphere. It's equipped with modern necessities such as whole-home Air Conditioning, sits on a private lot range, a refrigerator, and washer/dryer hookups. The kitchen stands out with its granite and quartz counters. Throughout the home, you'll find luxury vinyl plank flooring paired with appealing tiled bathrooms.
This one-story home sits on a very large lot, more than a fifth of an acre of land and the backyard is fenced-in.
Park with confidence in your dedicated Driveway.
Applications are processed in the order they are completed and received. We gladly accept Section 8 / Housing Choice Vouchers. We consider a variety of factors, including household income, estimated living expenses, and credit history in our application review process. Application does not guarantee a lease.
American Avenue is an Equal Housing Lessor under the FHA. Applicable local, state and federal laws may apply. Lease terms and conditions apply. This is not an offer to rent. You must submit additional information for review and approval. Listing features may not be accurate and should be confirmed by touring the home.
Avoid rental scams! American Avenue does not list homes on Facebook Marketplace, TikTok, or Craigslist. We will never ask you to pay money via Zelle, CashApp, Bitcoin, or any method outside our website. Do not trust anyone offering you this home for a lower price than you see advertised here.
Click "Request a tour" to schedule your free self-tour.
In addition to monthly rent, tenants pay for all utilities, and if American Avenue or a third party processes any utility bills on the tenant’s behalf, an additional Utility Bill Management fee of $14.99 per month applies. Tenants must pay for the Resident Protection Plus+ program ($53.68 per month). Animal Rent is $55 per pet per month (subject to applicable law).

Map
Property History
| Date | Event | Price | List to Sale | Price per Sq Ft |
|---|---|---|---|---|
| 02/03/2026 02/03/26 | Price Changed | $997 | -7.3% | $1 / Sq Ft |
| 01/31/2026 01/31/26 | For Rent | $1,075 | 0.0% | -- |
| 01/25/2026 01/25/26 | Off Market | $1,075 | -- | -- |
| 12/05/2025 12/05/25 | Price Changed | $1,075 | -2.3% | $1 / Sq Ft |
| 12/02/2025 12/02/25 | Price Changed | $1,100 | -2.0% | $1 / Sq Ft |
| 11/25/2025 11/25/25 | Price Changed | $1,122 | -4.3% | $1 / Sq Ft |
| 11/23/2025 11/23/25 | Price Changed | $1,172 | -2.1% | $1 / Sq Ft |
| 11/22/2025 11/22/25 | Price Changed | $1,197 | -4.2% | $1 / Sq Ft |
| 11/15/2025 11/15/25 | Price Changed | $1,250 | -5.7% | $1 / Sq Ft |
| 11/12/2025 11/12/25 | Price Changed | $1,325 | -7.0% | $1 / Sq Ft |
| 10/24/2025 10/24/25 | For Rent | $1,425 | -- | -- |
- 2807 Doyle Ave
- 2924 Gleason Ave
- 2946 Gleason Ave
- 5923 Nassau Cir
- 6000 Caribou Dr
- 6059 Nassau Cir
- 3120 Urban Ave
- 2513 Lacey Oak Ct
- 2525 Corineth Dr
- 3301 Musket Dr
- 2500 Water Oak Dr
- 2672 Honeysuckle Dr
- 6311 Morning Dew Dr
- 6303 Morning Dew Dr
- 6302 Morning Dew Dr
- 6307 Morning Dew Dr
- 5773 Marlette Ct
- 5725 Marlette Ct
- 6362 Lemongrass Dr
- 5759 Forrest Rd
- 2879 Doyle Ave
- 3026 Gleason Ave
- 2626 Honeysuckle Dr
- 6150 Hunter Ridge Cir
- 2118 Skylake Dr Unit ID1043831P
- 2227 Danbury Dr
- 5903 Blueridge Dr
- 5124 Seneca Dr
- 1514 Floyd Rd
- 4849 Wellborn Dr
- 108 Mitchell Ridge Place
- 4970 Gardiner Dr
- 1337 Sturkie Ave
- 4312 Old MacOn Rd Unit 41
- 4718 Marino St
- 6914 Aldora Dr
- 5220 Teresa St
- 6913 Dorsey Dr
- 4282 Adams St
- 148 Sweetwater Dr