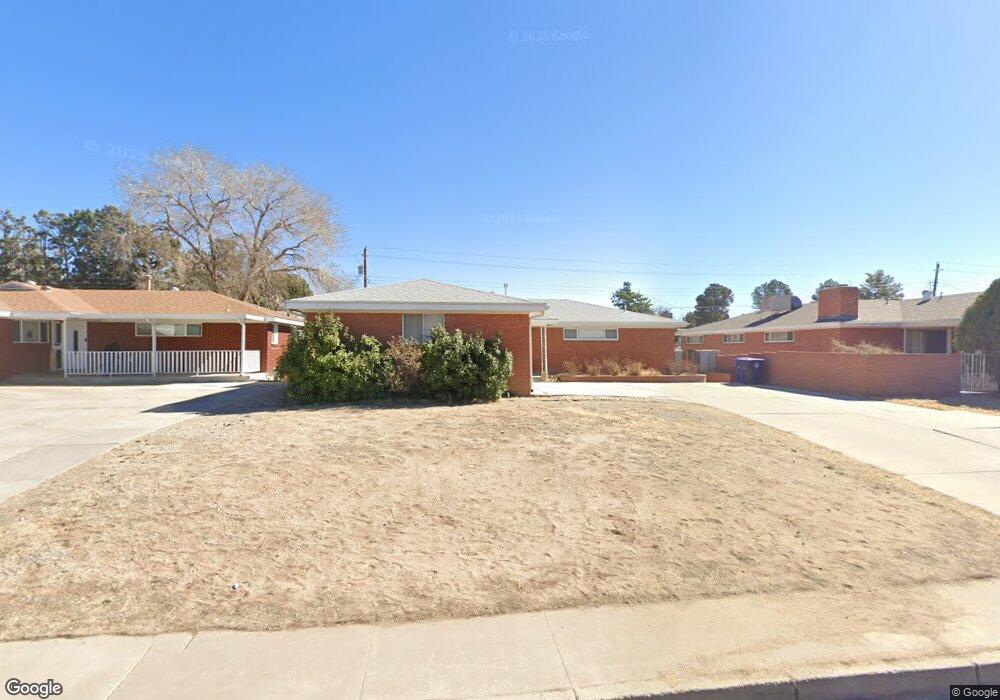
2904 Espanola St NE Albuquerque, NM 87110
Uptown NeighborhoodEstimated Value: $432,000 - $532,000
4
Beds
3
Baths
3,048
Sq Ft
$155/Sq Ft
Est. Value
About This Home
This home is located at 2904 Espanola St NE, Albuquerque, NM 87110 and is currently estimated at $471,521, approximately $154 per square foot. 2904 Espanola St NE is a home located in Bernalillo County with nearby schools including Zuni Elementary School, Cleveland Middle School, and Sandia High School.
Ownership History
Date
Name
Owned For
Owner Type
Purchase Details
Closed on
Feb 1, 2024
Sold by
Evans William L and Evans Ginny M
Bought by
William And Ginny Evans Trust and Evans
Current Estimated Value
Purchase Details
Closed on
Feb 12, 2021
Sold by
Roybal Sandra L
Bought by
Mv Llc
Purchase Details
Closed on
Jun 21, 2013
Sold by
Evans William L
Bought by
Evans William
Home Financials for this Owner
Home Financials are based on the most recent Mortgage that was taken out on this home.
Original Mortgage
$216,930
Interest Rate
3.54%
Mortgage Type
VA
Purchase Details
Closed on
Aug 30, 2004
Sold by
Goebel Carmen Virginia and Goebel Morris Ralph
Bought by
Evans Ii William L and Evans Michell R
Home Financials for this Owner
Home Financials are based on the most recent Mortgage that was taken out on this home.
Original Mortgage
$246,046
Interest Rate
5.12%
Mortgage Type
VA
Create a Home Valuation Report for This Property
The Home Valuation Report is an in-depth analysis detailing your home's value as well as a comparison with similar homes in the area
Home Values in the Area
Average Home Value in this Area
Purchase History
| Date | Buyer | Sale Price | Title Company |
|---|---|---|---|
| William And Ginny Evans Trust | -- | None Listed On Document | |
| Mv Llc | -- | Stewart Title | |
| Evans William | -- | Fidelity National Title Insu | |
| Evans Ii William L | -- | Stewart Title |
Source: Public Records
Mortgage History
| Date | Status | Borrower | Loan Amount |
|---|---|---|---|
| Previous Owner | Evans William | $216,930 | |
| Previous Owner | Evans Ii William L | $246,046 |
Source: Public Records
Tax History Compared to Growth
Tax History
| Year | Tax Paid | Tax Assessment Tax Assessment Total Assessment is a certain percentage of the fair market value that is determined by local assessors to be the total taxable value of land and additions on the property. | Land | Improvement |
|---|---|---|---|---|
| 2025 | $3,346 | $87,863 | $14,296 | $73,567 |
| 2024 | $3,346 | $85,304 | $13,879 | $71,425 |
| 2023 | $3,283 | $82,819 | $13,475 | $69,344 |
| 2022 | $3,165 | $80,408 | $13,083 | $67,325 |
| 2021 | $3,051 | $78,066 | $12,702 | $65,364 |
| 2020 | $2,994 | $75,792 | $12,332 | $63,460 |
| 2019 | $2,997 | $75,887 | $13,879 | $62,008 |
| 2018 | $2,883 | $75,887 | $13,879 | $62,008 |
| 2017 | $2,787 | $73,678 | $13,475 | $60,203 |
| 2016 | $2,699 | $69,449 | $12,702 | $56,747 |
| 2015 | $67,426 | $67,426 | $12,332 | $55,094 |
| 2014 | $2,635 | $68,060 | $12,332 | $55,728 |
| 2013 | -- | $59,885 | $13,078 | $46,807 |
Source: Public Records
Map
Nearby Homes
- 2908 Pennsylvania St NE
- 3105 Dallas St NE
- 7029 Veranda Rd NE
- 3109 Dallas St NE
- 3108 Dallas St NE
- 2724 Pennsylvania St NE
- 2720 Pennsylvania St NE
- 2916 Indiana St NE
- 2732 Kentucky St NE
- 2816 Indiana St NE
- 2829 Indiana St NE
- 7101 Aztec Rd NE
- 2824 Texas St NE
- 2936 Carolina St NE
- 2720 Dakota St NE
- 2424 Louisiana Blvd NE Unit 403
- 3101 Vermont St NE
- 2627 Dakota St NE
- 8205 Connecticut St NE
- 8213 Connecticut St NE
- 2908 Espanola St NE
- 2900 Espanola St NE
- 2912 Espanola St NE
- 2905 San Pablo St NE
- 2901 San Pablo St NE
- 2909 San Pablo St NE
- 2905 Espanola St NE
- 2913 San Pablo St NE
- 2916 Espanola St NE
- 2901 Espanola St NE
- 2909 Espanola St NE
- 2828 Espanola St NE
- 2917 San Pablo St NE
- 2913 Espanola St NE
- 2829 San Pablo St NE
- 2920 Espanola St NE
- 2904 Mesilla St NE
- 2824 Espanola St NE
- 2921 San Pablo St NE
- 7101 Los Arboles Ave NE