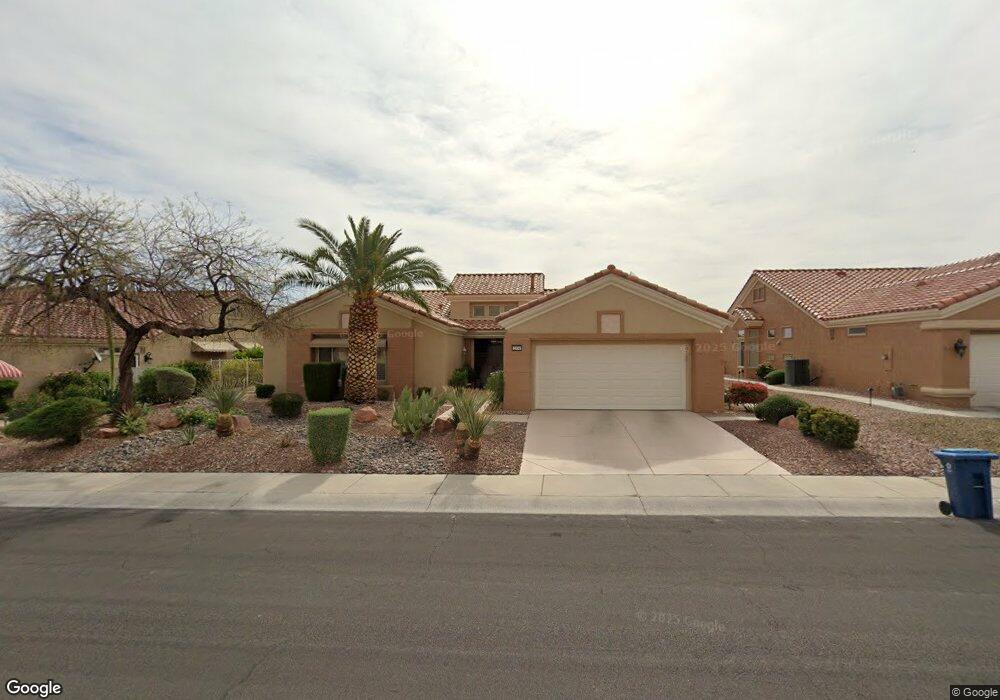
2904 High Range Dr Las Vegas, NV 89134
Summerlin NeighborhoodEstimated Value: $732,000 - $807,000
3
Beds
2
Baths
2,210
Sq Ft
$348/Sq Ft
Est. Value
About This Home
This home is located at 2904 High Range Dr, Las Vegas, NV 89134 and is currently estimated at $769,340, approximately $348 per square foot. 2904 High Range Dr is a home located in Clark County with nearby schools including William Lummis Elementary School, Ernest Becker Middle School, and Palo Verde High School.
Ownership History
Date
Name
Owned For
Owner Type
Purchase Details
Closed on
Nov 1, 2013
Sold by
Seaton Lynda Jane
Bought by
Seaton Lynda Jane and Lynda Jane Seaton Family Trust
Current Estimated Value
Purchase Details
Closed on
Jan 28, 2005
Sold by
Collins Rayburn D and Collins Linda F
Bought by
Seaton Lynda Jane and Hoffman Lois Alice
Purchase Details
Closed on
Oct 25, 1999
Sold by
Whaley Albert H and Whaley Mary S
Bought by
Collins Rayburn D and Collins Linda F
Purchase Details
Closed on
Dec 9, 1996
Sold by
Whaley Albert H and Whaley Mary S
Bought by
Whaley Albert H and Whaley Mary S
Purchase Details
Closed on
Dec 4, 1996
Sold by
Whaley Albert H and Whaley Mary S
Bought by
Whaley Albert H and Whaley Mary S
Purchase Details
Closed on
Mar 8, 1996
Sold by
Del Webb Communities Inc
Bought by
Whaley Albert H and Whaley Mary S
Create a Home Valuation Report for This Property
The Home Valuation Report is an in-depth analysis detailing your home's value as well as a comparison with similar homes in the area
Home Values in the Area
Average Home Value in this Area
Purchase History
| Date | Buyer | Sale Price | Title Company |
|---|---|---|---|
| Seaton Lynda Jane | -- | None Available | |
| Seaton Lynda Jane | $500,000 | Old Republic Title Co Of Nv | |
| Collins Rayburn D | $350,000 | Old Republic Title Company | |
| Whaley Albert H | -- | -- | |
| Whaley Albert H | -- | -- | |
| Whaley Albert H | $270,000 | First American Title Co |
Source: Public Records
Tax History Compared to Growth
Tax History
| Year | Tax Paid | Tax Assessment Tax Assessment Total Assessment is a certain percentage of the fair market value that is determined by local assessors to be the total taxable value of land and additions on the property. | Land | Improvement |
|---|---|---|---|---|
| 2025 | $3,952 | $158,669 | $73,990 | $84,679 |
| 2024 | $3,952 | $158,669 | $73,990 | $84,679 |
| 2023 | $3,952 | $145,297 | $64,750 | $80,547 |
| 2022 | $3,837 | $130,016 | $56,000 | $74,016 |
| 2021 | $3,725 | $119,491 | $49,070 | $70,421 |
| 2020 | $3,614 | $118,904 | $49,070 | $69,834 |
| 2019 | $3,570 | $113,006 | $44,065 | $68,941 |
| 2018 | $3,406 | $106,623 | $39,830 | $66,793 |
| 2017 | $3,458 | $104,620 | $37,520 | $67,100 |
| 2016 | $3,188 | $98,784 | $31,710 | $67,074 |
| 2015 | $3,181 | $94,904 | $28,630 | $66,274 |
| 2014 | $3,089 | $90,553 | $26,705 | $63,848 |
Source: Public Records
Map
Nearby Homes
- 2925 Lotus Hill Dr
- 9908 Bundella Dr
- 9905 Hemet Dr
- 3004 Lotus Hill Dr
- 3016 Cradle Mountain Dr
- 9800 Villa Ridge Dr
- 9948 Bundella Dr
- 9929 Hemet Dr
- 2725 Youngdale Dr
- 9816 Villa Ridge Dr
- 3112 Haddon Dr
- 2837 Billy Casper Dr
- 10012 Bundella Dr
- 9937 Villa Ridge Dr
- 3109 Hawksdale Dr Unit 27
- 2712 Lotus Hill Dr
- 9909 Woodhouse Dr
- 10004 Heyfield Dr
- 3033 Bonnie Rock Dr
- 3020 Ripon Dr
- 2908 High Range Dr
- 2900 High Range Dr
- 2912 High Range Dr
- 2905 High Range Dr
- 2909 High Range Dr
- 2901 High Range Dr
- 2913 High Range Dr
- 2916 High Range Dr
- 2917 High Range Dr
- 9801 Gerald Ct
- 2840 High Range Dr
- 9800 Gerald Ct
- 3000 High Range Dr
- 3001 High Range Dr
- 2836 High Range Dr
- 9805 Gerald Ct
- 9804 Gerald Ct
- 3004 High Range Dr
- 3005 High Range Dr
- 9800 Bundella Dr