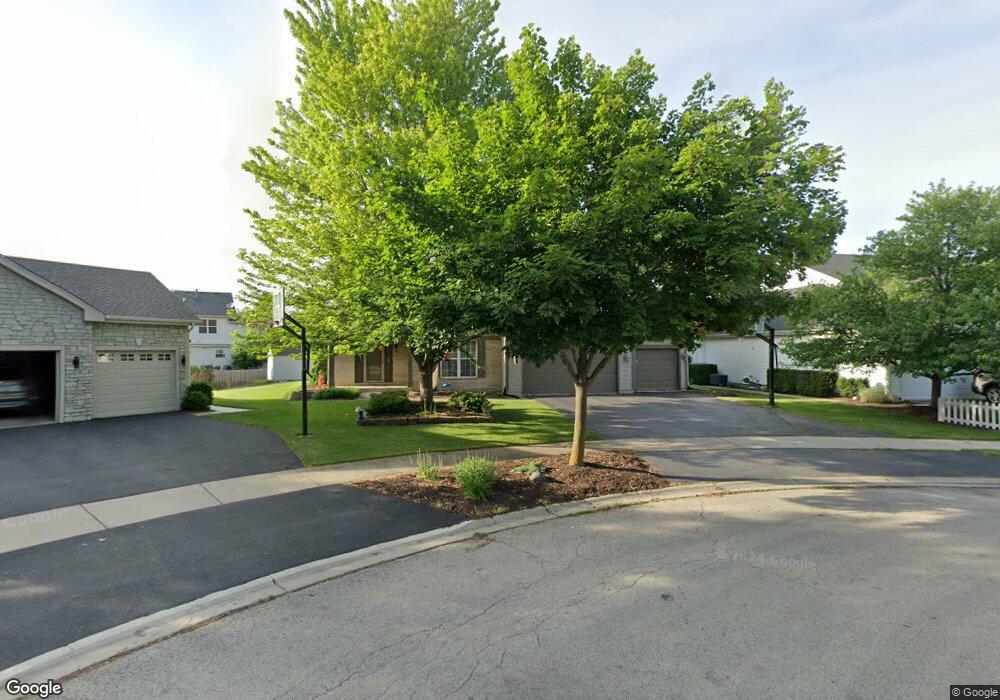
2904 Lahinch Ct Aurora, IL 60503
Far Southeast NeighborhoodEstimated Value: $509,000 - $654,000
4
Beds
5
Baths
4,430
Sq Ft
$133/Sq Ft
Est. Value
About This Home
This home is located at 2904 Lahinch Ct, Aurora, IL 60503 and is currently estimated at $589,704, approximately $133 per square foot. 2904 Lahinch Ct is a home located in Will County with nearby schools including Wolfs Crossing Elementary School, Bednarcik Jr. High School, and Oswego East High School.
Ownership History
Date
Name
Owned For
Owner Type
Purchase Details
Closed on
Sep 1, 2017
Sold by
Butts Andrew E and Butts Jessica A
Bought by
Shukla Niral Guarang and Shukla Purvi Niral
Current Estimated Value
Home Financials for this Owner
Home Financials are based on the most recent Mortgage that was taken out on this home.
Original Mortgage
$310,000
Outstanding Balance
$259,496
Interest Rate
3.99%
Mortgage Type
New Conventional
Estimated Equity
$330,208
Purchase Details
Closed on
Nov 20, 2001
Sold by
Lakewood Valley Phase Ii Llc
Bought by
Butts Andrew E and Butts Jessica A
Home Financials for this Owner
Home Financials are based on the most recent Mortgage that was taken out on this home.
Original Mortgage
$291,600
Interest Rate
6.68%
Create a Home Valuation Report for This Property
The Home Valuation Report is an in-depth analysis detailing your home's value as well as a comparison with similar homes in the area
Home Values in the Area
Average Home Value in this Area
Purchase History
| Date | Buyer | Sale Price | Title Company |
|---|---|---|---|
| Shukla Niral Guarang | $387,500 | Baird & Warner Title Svcs In | |
| Butts Andrew E | $307,500 | Chicago Title Insurance Co |
Source: Public Records
Mortgage History
| Date | Status | Borrower | Loan Amount |
|---|---|---|---|
| Open | Shukla Niral Guarang | $310,000 | |
| Previous Owner | Butts Andrew E | $291,600 |
Source: Public Records
Tax History Compared to Growth
Tax History
| Year | Tax Paid | Tax Assessment Tax Assessment Total Assessment is a certain percentage of the fair market value that is determined by local assessors to be the total taxable value of land and additions on the property. | Land | Improvement |
|---|---|---|---|---|
| 2024 | $16,232 | $194,231 | $23,259 | $170,972 |
| 2023 | $16,232 | $171,582 | $20,547 | $151,035 |
| 2022 | $15,593 | $142,132 | $19,437 | $122,695 |
| 2021 | $13,475 | $135,363 | $18,511 | $116,852 |
| 2020 | $12,904 | $133,218 | $18,218 | $115,000 |
| 2019 | $13,481 | $129,464 | $17,705 | $111,759 |
| 2018 | $11,794 | $110,337 | $17,315 | $93,022 |
| 2017 | $11,696 | $107,489 | $16,868 | $90,621 |
| 2016 | $11,590 | $105,175 | $16,505 | $88,670 |
| 2015 | $12,482 | $101,130 | $15,870 | $85,260 |
| 2014 | $12,482 | $101,130 | $15,870 | $85,260 |
| 2013 | $12,482 | $101,130 | $15,870 | $85,260 |
Source: Public Records
Map
Nearby Homes
- 2895 Lahinch Ct Unit 6
- 2969 Francis Ct
- 9836 S Carls Dr
- 2532 Sagamore Cir
- 4308 Fraser Cir
- 2735 Hillsboro Blvd Unit 3
- 2746 Hillsboro Blvd
- 2413 Dickens Dr
- 2723 Hillsboro Blvd
- 4446 Monroe Ct
- 4449 Monroe Ct
- 2967 Madison Dr
- 3218 Lincoln Prairie Blvd
- 3258 Mirehaven Ct
- 3274 Mirehaven Ct
- 2836 Hillcrest Cir
- 3273 Mirehaven Dr
- 3106 Adelwood Cir
- 3150 Adelwood Cir
- 3120 Adelwood Dr
- 2914 Lahinch Ct Unit 6
- 2894 Lahinch Ct Unit 6
- 2885 Shenandoah Dr Unit 6
- 2873 Shenandoah Dr Unit 6
- 2909 Shenandoah Dr Unit 6
- 2884 Lahinch Ct
- 2861 Shenandoah Dr
- 2915 Lahinch Ct Unit 6
- 2680 Lindgren Trail
- 2676 Lindgren Trail Unit 6
- 2905 Lahinch Ct
- 2652 Lahinch Dr Unit 6
- 2963 Francis Ct
- 2997 Stonecrop Dr
- 2995 Stonecrop Dr
- 2990 Stonecrop Dr
- 2986 Stonecrop Dr
- 2988 Stonecrop Dr
- 2672 Lahinch Dr Unit 6
- 2688 Lindgren Trail Unit 6