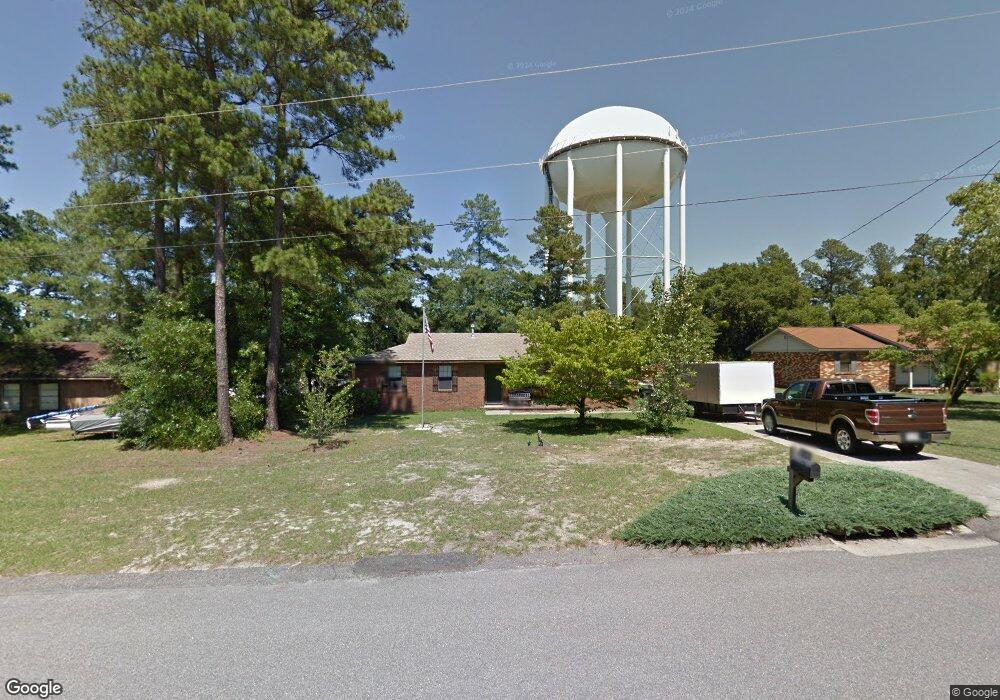
2904 Tower Pines Dr Augusta, GA 30909
Belair NeighborhoodEstimated Value: $212,000 - $214,000
3
Beds
2
Baths
1,428
Sq Ft
$149/Sq Ft
Est. Value
About This Home
This home is located at 2904 Tower Pines Dr, Augusta, GA 30909 and is currently estimated at $213,413, approximately $149 per square foot. 2904 Tower Pines Dr is a home located in Richmond County with nearby schools including First Coast Technical Institute, Johnson Magnet, and Westside High School.
Ownership History
Date
Name
Owned For
Owner Type
Purchase Details
Closed on
May 6, 1996
Sold by
Sanders Terri D Grant Terri D
Bought by
Ward Keith Allen
Current Estimated Value
Purchase Details
Closed on
Apr 24, 1996
Sold by
Sanders Terri D
Bought by
Ward Keith Allen
Purchase Details
Closed on
Oct 18, 1994
Sold by
Grant Wesley C
Bought by
Grant Terri D
Purchase Details
Closed on
Oct 14, 1994
Sold by
Grant Wesley C
Bought by
Grant Terri D
Purchase Details
Closed on
Mar 6, 1990
Sold by
Regis Builders Inc
Bought by
Grant Wesley C Grant Terri D
Purchase Details
Closed on
Feb 28, 1990
Sold by
Regis Builders Inc
Bought by
Grant Wesley C
Create a Home Valuation Report for This Property
The Home Valuation Report is an in-depth analysis detailing your home's value as well as a comparison with similar homes in the area
Home Values in the Area
Average Home Value in this Area
Purchase History
| Date | Buyer | Sale Price | Title Company |
|---|---|---|---|
| Ward Keith Allen | -- | -- | |
| Ward Keith Allen | $71,300 | -- | |
| Grant Terri D | -- | -- | |
| Grant Terri D | -- | -- | |
| Grant Wesley C Grant Terri D | $2,000 | -- | |
| Grant Wesley C | $53,400 | -- |
Source: Public Records
Tax History Compared to Growth
Tax History
| Year | Tax Paid | Tax Assessment Tax Assessment Total Assessment is a certain percentage of the fair market value that is determined by local assessors to be the total taxable value of land and additions on the property. | Land | Improvement |
|---|---|---|---|---|
| 2025 | $2,515 | $76,124 | $10,600 | $65,524 |
| 2024 | $2,515 | $70,172 | $10,600 | $59,572 |
| 2023 | $2,280 | $70,752 | $10,600 | $60,152 |
| 2022 | $1,730 | $47,660 | $10,600 | $37,060 |
| 2021 | $1,724 | $43,212 | $10,600 | $32,612 |
| 2020 | $1,698 | $43,212 | $10,600 | $32,612 |
| 2019 | $1,412 | $36,423 | $8,480 | $27,943 |
| 2018 | $1,421 | $36,423 | $8,480 | $27,943 |
| 2017 | $1,387 | $36,423 | $8,480 | $27,943 |
| 2016 | $1,388 | $36,423 | $8,480 | $27,943 |
| 2015 | $1,396 | $36,423 | $8,480 | $27,943 |
| 2014 | $1,394 | $36,293 | $8,480 | $27,813 |
Source: Public Records
Map
Nearby Homes
- 2924 Belwood Dr
- 1609 Orange Ave
- 3946 Carolyn St
- 3908 Carolyn St
- 3920 Carolyn St
- 3985 Belair Rd
- 704 Leela Ct
- 4413 Wrightsboro Rd
- 3902 Maddox Rd
- 1120 George W Crawford Dr
- 4128 Powell Mill Rd
- 2362 Belair Spring Rd
- 2305 Belair Spring Rd
- 3830 Maddox Rd
- 2355 Belair Spring Rd
- 2977 Galahad Way
- 2344 Belair Spring Rd
- 3025 Brockham Ct
- 2339 Belair Spring Rd
- 2902 Tower Pines Dr
- 2906 Tower Pines Dr
- 2903 Tower Pines Dr
- 2908 Tower Pines Dr
- 3202 Yellow Pine Dr
- 3203 Yellow Pine Dr
- 2910 Tower Pines Dr
- 3205 Yellow Pine Dr
- 2907 Tower Pines Dr
- 3952 Belair Rd
- 3204 Yellow Pine Dr
- 3941 Belair Rd
- 3939 Belair Rd
- 2912 Tower Pines Dr
- 2901 Kings View Dr
- 3207 Yellow Pine Dr
- 3937 Belair Rd
- 2909 Tower Pines Dr
- 3206 Yellow Pine Dr
- 2914 Tower Pines Dr