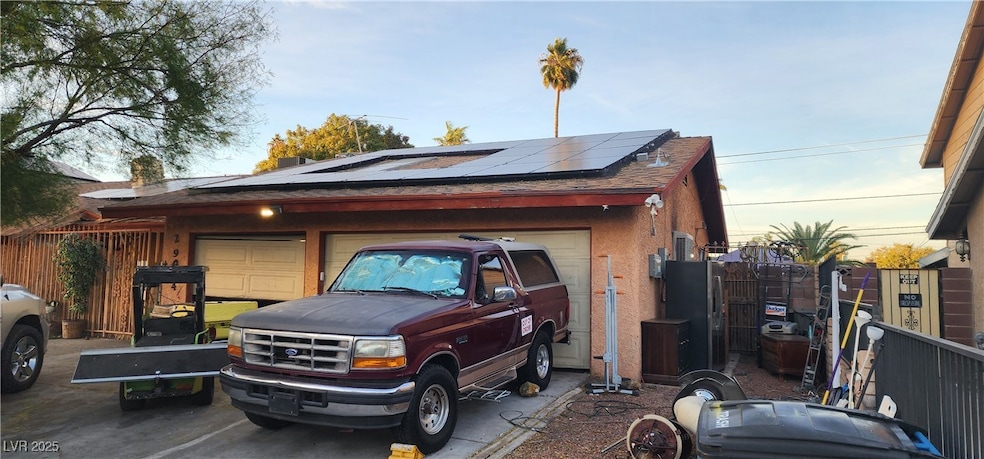


2904 W Oakey Blvd Las Vegas, NV 89102
Rancho Oakey NeighborhoodEstimated payment $3,614/month
Highlights
- Active Adult
- Deck
- No HOA
- Solar Power System
- Family Room with Fireplace
- 1-minute walk to Bob Baskin Park
About This Home
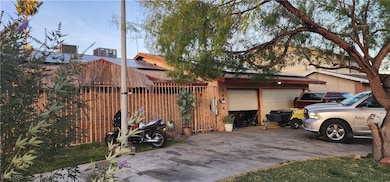
This home has a Tons of potential. It’s a large Single-Story Home with a massive 11,000 ft Lot. The home features 4 bedrooms with a large owners suite, and a huge family room and living room, 2 Fireplaces and 2,628 sqft of living space. Plus a 3 Car attached garage and a massive private backyard that is also close to a nearby park.
Home Details
Home Type
- Single Family
Est. Annual Taxes
- $2,894
Year Built
- Built in 1978
Lot Details
- 0.26 Acre Lot
- South Facing Home
- Dog Run
- Back Yard Fenced
- Block Wall Fence
Parking
- 3 Car Attached Garage
- Inside Entrance
Home Design
- Asphalt Roof
Interior Spaces
- 3,015 Sq Ft Home
- 1-Story Property
- Ceiling Fan
- Wood Burning Fireplace
- Blinds
- Family Room with Fireplace
- 2 Fireplaces
- Living Room with Fireplace
Kitchen
- Built-In Electric Oven
- Electric Cooktop
- Disposal
Flooring
- Carpet
- Linoleum
- Vinyl
Bedrooms and Bathrooms
- 4 Bedrooms
Laundry
- Laundry Room
- Laundry on main level
- Gas Dryer Hookup
Accessible Home Design
- Handicap Accessible
Eco-Friendly Details
- Solar Power System
- Solar owned by seller
- Solar Heating System
Outdoor Features
- Deck
- Covered Patio or Porch
Schools
- Wasden Elementary School
- Hyde Park Middle School
- Clark Ed. W. High School
Utilities
- Central Heating and Cooling System
- Heating System Uses Gas
- Underground Utilities
Community Details
- Active Adult
- No Home Owners Association
- Mcneil Manor Tr 3 Amd Subdivision
Map
Home Values in the Area
Average Home Value in this Area
Tax History
| Year | Tax Paid | Tax Assessment Tax Assessment Total Assessment is a certain percentage of the fair market value that is determined by local assessors to be the total taxable value of land and additions on the property. | Land | Improvement |
|---|---|---|---|---|
| 2025 | $2,894 | $109,842 | $61,740 | $48,102 |
| 2024 | $2,554 | $109,842 | $61,740 | $48,102 |
| 2023 | $2,554 | $100,673 | $52,920 | $47,753 |
| 2022 | $2,396 | $92,112 | $47,408 | $44,704 |
| 2021 | $2,327 | $87,634 | $44,275 | $43,359 |
| 2020 | $2,256 | $84,645 | $40,810 | $43,835 |
| 2019 | $2,190 | $80,985 | $36,960 | $44,025 |
| 2018 | $2,126 | $80,015 | $36,960 | $43,055 |
| 2017 | $2,590 | $79,003 | $34,650 | $44,353 |
| 2016 | $2,014 | $68,882 | $23,100 | $45,782 |
| 2015 | $2,009 | $65,134 | $19,250 | $45,884 |
| 2014 | $1,951 | $57,739 | $11,550 | $46,189 |
Property History
| Date | Event | Price | List to Sale | Price per Sq Ft |
|---|---|---|---|---|
| 11/06/2025 11/06/25 | For Sale | $640,000 | -- | $212 / Sq Ft |
Purchase History
| Date | Type | Sale Price | Title Company |
|---|---|---|---|
| Interfamily Deed Transfer | -- | None Available | |
| Interfamily Deed Transfer | -- | Nevada Title Company | |
| Bargain Sale Deed | $172,000 | Nevada Title Company |
Mortgage History
| Date | Status | Loan Amount | Loan Type |
|---|---|---|---|
| Open | $50,000 | Credit Line Revolving | |
| Open | $163,400 | No Value Available |
Source: Las Vegas REALTORS®
MLS Number: 2733336
APN: 162-05-617-003
Disclaimer: Certain information contained herein is derived from information provided by parties other than Homes.com. All information provided is deemed reliable, but is not guaranteed to be accurate and should be independently verified.
![]() The data relating to real estate for sale on this web site comes in part from the INTERNET DATA EXCHANGE Program of the Greater Las Vegas Association of REALTORS® MLS. Real estate listings held by brokerage firms other than this site owner are marked with the IDX logo. Information is deemed reliable but not guaranteed. Copyright 2025 of the Greater Las Vegas Association of REALTORS® MLS. All rights reserved.
The data relating to real estate for sale on this web site comes in part from the INTERNET DATA EXCHANGE Program of the Greater Las Vegas Association of REALTORS® MLS. Real estate listings held by brokerage firms other than this site owner are marked with the IDX logo. Information is deemed reliable but not guaranteed. Copyright 2025 of the Greater Las Vegas Association of REALTORS® MLS. All rights reserved.
- 2809 Bryant Ave
- 3104 Calle de El Cortez
- 3101 Calle de El Cortez
- 1608 Eaton Dr
- 2101 Calle de Espana
- 1242 Campbell Dr Unit 89102
- 2500 W Oakey Blvd
- 2505 Laurie Dr
- 2901 Ashby Ave
- 1234 Campbell Dr
- 3004 El Camino Ave
- 2504 Llewellyn Dr
- 2400 La Solana Way
- 3408 Calle de Corrida
- 2800 Ashby Ave
- 2300 Plaza Del Grande
- 2116 Plaza Del Fuentes
- 3420 Calle de Corrida
- 3506 Westleigh Ave
- 2216 Plaza Del Robles
- 3012 Bryant Ave
- 1600 Eaton Dr
- 3011 Burton Ave
- 3204 Bryant Ave
- 1505 Strong Dr
- 2728 Miraflores Ave
- 2505 Laurie Dr Unit C
- 2505 Laurie Dr Unit A
- 2420 Laurie Dr
- 2900 El Camino Ave
- 2600 Sidonia Ave
- 3500 El Cortez Ave
- 3328 Plaza Del Paz
- 1336 Darmak Dr
- 1513 Bryn Mawr Ave
- 1201 Douglas Dr
- 2301 S Valley View Blvd
- 1600 S Valley View Blvd
- 2400 Sherman Place
- 2800 Alcoa Ave
