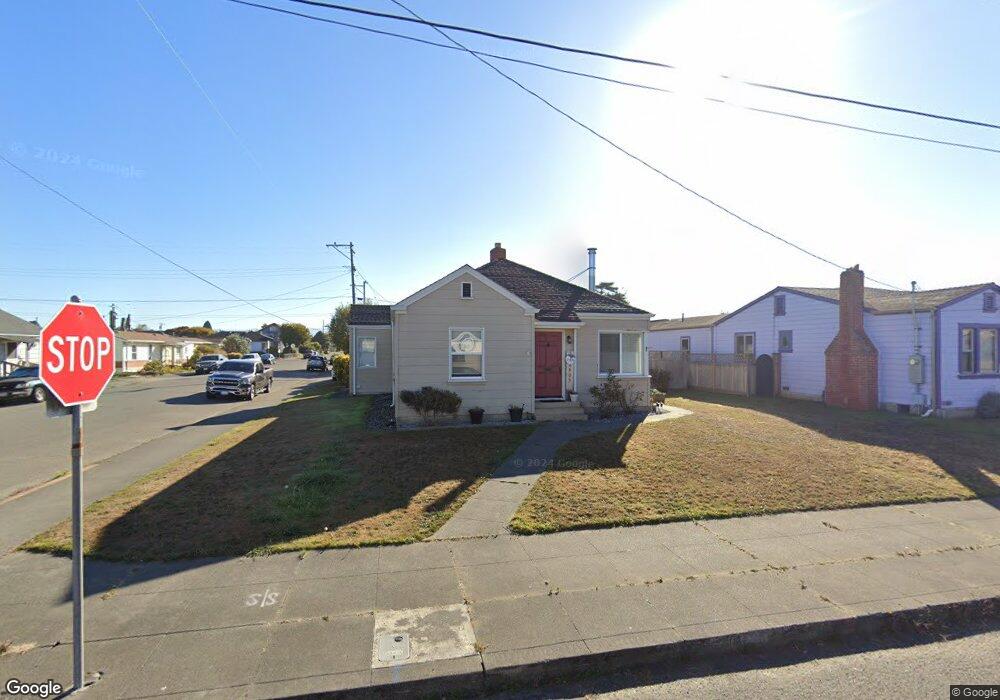
2905 A St Eureka, CA 95501
Fairfield NeighborhoodEstimated Value: $321,000 - $375,000
3
Beds
1
Bath
1,208
Sq Ft
$280/Sq Ft
Est. Value
About This Home
This home is located at 2905 A St, Eureka, CA 95501 and is currently estimated at $337,825, approximately $279 per square foot. 2905 A St is a home located in Humboldt County with nearby schools including Grant Elementary School, Winship Middle School, and Eureka Senior High School.
Ownership History
Date
Name
Owned For
Owner Type
Purchase Details
Closed on
Jan 22, 2015
Sold by
Roby Monica S
Bought by
Roby Jack D and Roby Monica S
Current Estimated Value
Home Financials for this Owner
Home Financials are based on the most recent Mortgage that was taken out on this home.
Original Mortgage
$75,000
Outstanding Balance
$27,516
Interest Rate
4.87%
Mortgage Type
Adjustable Rate Mortgage/ARM
Estimated Equity
$310,309
Purchase Details
Closed on
Aug 13, 2014
Sold by
Kay William T and Estate Of Lorrance Wayne Mills
Bought by
Roby Monica S
Purchase Details
Closed on
Sep 8, 2000
Sold by
Long Patricia M and Brown Ronald A
Bought by
Millsap Lorrance W
Home Financials for this Owner
Home Financials are based on the most recent Mortgage that was taken out on this home.
Original Mortgage
$83,250
Interest Rate
8.07%
Purchase Details
Closed on
Jan 28, 1999
Sold by
Brown Ronald A and Brown Allynee L
Bought by
Brown Ronald A and Brown Allynee L
Create a Home Valuation Report for This Property
The Home Valuation Report is an in-depth analysis detailing your home's value as well as a comparison with similar homes in the area
Home Values in the Area
Average Home Value in this Area
Purchase History
| Date | Buyer | Sale Price | Title Company |
|---|---|---|---|
| Roby Jack D | -- | Humboldt Land Title Company | |
| Roby Monica S | -- | None Available | |
| Millsap Lorrance W | $92,500 | Humboldt Land Title Company | |
| Brown Ronald A | -- | -- |
Source: Public Records
Mortgage History
| Date | Status | Borrower | Loan Amount |
|---|---|---|---|
| Open | Roby Jack D | $75,000 | |
| Closed | Millsap Lorrance W | $83,250 |
Source: Public Records
Tax History
| Year | Tax Paid | Tax Assessment Tax Assessment Total Assessment is a certain percentage of the fair market value that is determined by local assessors to be the total taxable value of land and additions on the property. | Land | Improvement |
|---|---|---|---|---|
| 2025 | $1,387 | $142,013 | $57,246 | $84,767 |
| 2024 | $1,387 | $139,229 | $56,124 | $83,105 |
| 2023 | $1,366 | $136,500 | $55,024 | $81,476 |
| 2022 | $1,417 | $133,825 | $53,946 | $79,879 |
| 2021 | $1,325 | $131,202 | $52,889 | $78,313 |
| 2020 | $1,315 | $129,857 | $52,347 | $77,510 |
| 2019 | $1,286 | $127,312 | $51,321 | $75,991 |
| 2018 | $1,265 | $124,816 | $50,315 | $74,501 |
| 2017 | $1,258 | $122,370 | $49,329 | $73,041 |
| 2016 | $1,256 | $119,971 | $48,362 | $71,609 |
| 2015 | $1,244 | $118,170 | $47,636 | $70,534 |
| 2014 | $1,236 | $115,856 | $46,703 | $69,153 |
Source: Public Records
Map
Nearby Homes
Your Personal Tour Guide
Ask me questions while you tour the home.