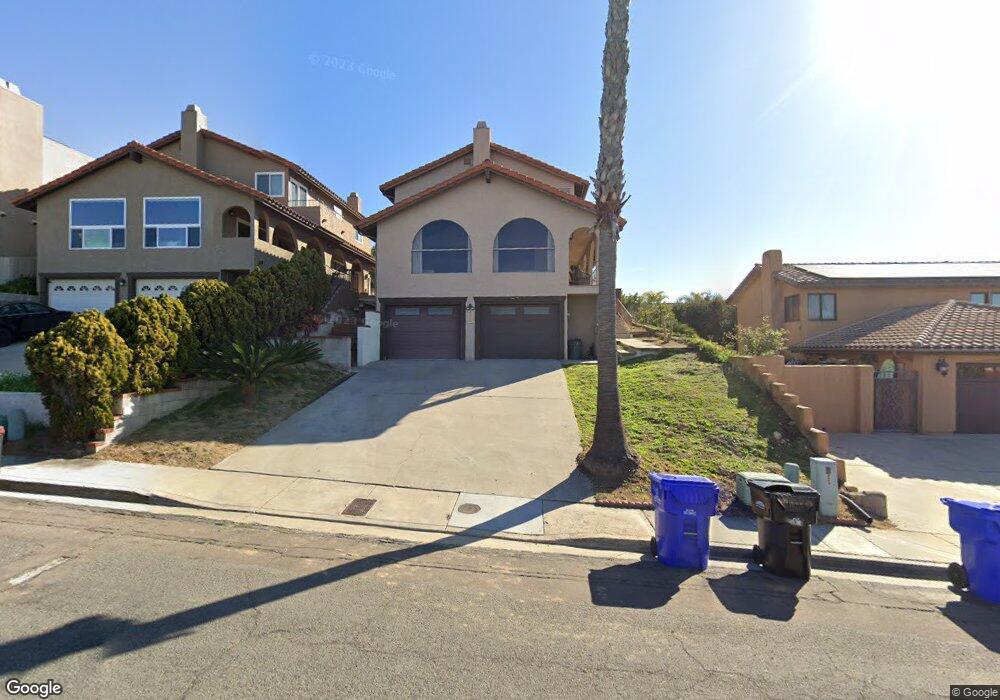
2905 Chicago St San Diego, CA 92117
Bay Park NeighborhoodEstimated Value: $1,864,669 - $2,025,000
4
Beds
4
Baths
2,442
Sq Ft
$794/Sq Ft
Est. Value
About This Home
This home is located at 2905 Chicago St, San Diego, CA 92117 and is currently estimated at $1,938,167, approximately $793 per square foot. 2905 Chicago St is a home located in San Diego County with nearby schools including Toler Elementary School, Marston Middle School, and Clairemont High School.
Ownership History
Date
Name
Owned For
Owner Type
Purchase Details
Closed on
Aug 25, 2016
Sold by
Gallant Group Investments General Partne
Bought by
Salem Ahmed A and Shama Suzanne
Current Estimated Value
Home Financials for this Owner
Home Financials are based on the most recent Mortgage that was taken out on this home.
Original Mortgage
$902,800
Outstanding Balance
$721,585
Interest Rate
3.45%
Mortgage Type
New Conventional
Estimated Equity
$1,216,582
Purchase Details
Closed on
Jun 5, 2007
Sold by
Gallant Charles and Merle Debora
Bought by
Gallant Group Investments General Partne
Purchase Details
Closed on
Apr 12, 2007
Sold by
Gallant Julie
Bought by
Gallant Charles and Merle Debora
Purchase Details
Closed on
Jan 5, 2006
Sold by
Gallant Jack J
Bought by
Gallant Jack J
Purchase Details
Closed on
Apr 4, 2003
Sold by
Gallant Jack J and Gallant Helen M
Bought by
Gallant Jack J
Create a Home Valuation Report for This Property
The Home Valuation Report is an in-depth analysis detailing your home's value as well as a comparison with similar homes in the area
Home Values in the Area
Average Home Value in this Area
Purchase History
| Date | Buyer | Sale Price | Title Company |
|---|---|---|---|
| Salem Ahmed A | $1,003,500 | California Title | |
| Gallant Group Investments General Partne | -- | None Available | |
| Gallant Charles | -- | None Available | |
| Gallant Jack J | -- | None Available | |
| Gallant Jack J | -- | -- |
Source: Public Records
Mortgage History
| Date | Status | Borrower | Loan Amount |
|---|---|---|---|
| Open | Salem Ahmed A | $902,800 |
Source: Public Records
Tax History Compared to Growth
Tax History
| Year | Tax Paid | Tax Assessment Tax Assessment Total Assessment is a certain percentage of the fair market value that is determined by local assessors to be the total taxable value of land and additions on the property. | Land | Improvement |
|---|---|---|---|---|
| 2025 | $13,968 | $1,164,410 | $754,378 | $410,032 |
| 2024 | $13,968 | $1,141,580 | $739,587 | $401,993 |
| 2023 | $13,659 | $1,119,197 | $725,086 | $394,111 |
| 2022 | $13,294 | $1,097,253 | $710,869 | $386,384 |
| 2021 | $13,202 | $1,075,739 | $696,931 | $378,808 |
| 2020 | $13,041 | $1,064,709 | $689,785 | $374,924 |
| 2019 | $12,807 | $1,043,833 | $676,260 | $367,573 |
| 2018 | $11,971 | $1,023,366 | $663,000 | $360,366 |
| 2017 | $80 | $1,003,300 | $650,000 | $353,300 |
| 2016 | $3,228 | $272,359 | $33,085 | $239,274 |
| 2015 | $3,181 | $268,269 | $32,589 | $235,680 |
| 2014 | $3,131 | $263,015 | $31,951 | $231,064 |
Source: Public Records
Map
Nearby Homes
- 2916 Chicago St
- 2841 Lloyd St
- 2910 Erie St
- 2514 Clairemont Dr Unit 306
- 2510 Clairemont Dr Unit 303
- 2540 Clairemont Dr Unit 202
- 2530 Clairemont Dr Unit 107
- 2540 Clairemont Dr Unit 307
- 2727 Morena Blvd Unit 309
- 2949 Erie St
- 2812 Hartford Ct
- 3212 Donley St
- 4603 Huron Ave
- 3154 Lloyd St
- 3226 Lloyd St
- 4850 Field St
- 3115 Geronimo Ave
- 4770 Jellett St
- 4732 Iroquois Ave Unit S
- 4436 Lister St
- 2911 Chicago St
- 2853 Chicago St
- 2915 Chicago St
- 2845 Chicago St
- 2923 Chicago St
- 2902 Denver St
- 2858 Denver St
- 2910 Denver St
- 2837 Chicago St
- 2933 Chicago St
- 2902 Chicago St
- 2904 Chicago St
- 2906 Chicago St
- 2924 Denver St
- 2854 Chicago St
- 2850 Denver St
- 2910 Chicago St
- 2910 Chicago St Unit 17
- 2928 Denver St
- 2912 Chicago St Unit 17