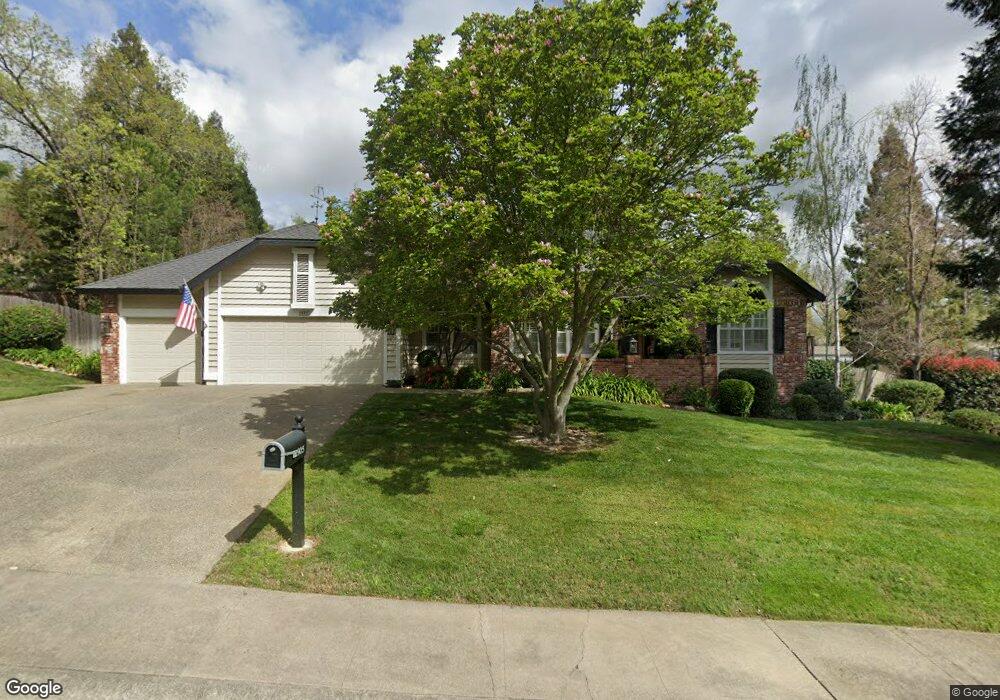
2905 Dry Gulch Ct Rocklin, CA 95677
Clover Valley Woods NeighborhoodEstimated Value: $674,000 - $997,000
4
Beds
3
Baths
2,650
Sq Ft
$330/Sq Ft
Est. Value
About This Home
This home is located at 2905 Dry Gulch Ct, Rocklin, CA 95677 and is currently estimated at $875,406, approximately $330 per square foot. 2905 Dry Gulch Ct is a home located in Placer County with nearby schools including Parker Whitney Elementary School, Spring View Middle School, and Rocklin High.
Ownership History
Date
Name
Owned For
Owner Type
Purchase Details
Closed on
Oct 3, 2023
Sold by
Rossi Eugene
Bought by
Eugene Paul Rossi 2019 Revocable Trust and Rossi
Current Estimated Value
Home Financials for this Owner
Home Financials are based on the most recent Mortgage that was taken out on this home.
Original Mortgage
$200,000
Outstanding Balance
$196,148
Interest Rate
7.23%
Mortgage Type
New Conventional
Estimated Equity
$679,258
Purchase Details
Closed on
Jan 11, 2019
Sold by
Rossi Eugene P
Bought by
Rossi Eugene Paul
Purchase Details
Closed on
Mar 23, 2017
Sold by
Rossi La Vonne
Bought by
Rossi Eugene P
Home Financials for this Owner
Home Financials are based on the most recent Mortgage that was taken out on this home.
Original Mortgage
$150,000
Interest Rate
3.37%
Mortgage Type
New Conventional
Purchase Details
Closed on
Aug 10, 2004
Sold by
Rossi Eugene P and Rossi Lavonne
Bought by
Rossi Eugene and Rossi La Vonne
Create a Home Valuation Report for This Property
The Home Valuation Report is an in-depth analysis detailing your home's value as well as a comparison with similar homes in the area
Home Values in the Area
Average Home Value in this Area
Purchase History
| Date | Buyer | Sale Price | Title Company |
|---|---|---|---|
| Eugene Paul Rossi 2019 Revocable Trust | -- | Chicago Title | |
| Rossi Eugene | -- | Chicago Title | |
| Rossi Eugene Paul | -- | None Available | |
| Rossi Eugene P | -- | None Available | |
| Rossi Eugene P | -- | None Available | |
| Rossi Eugene | -- | -- |
Source: Public Records
Mortgage History
| Date | Status | Borrower | Loan Amount |
|---|---|---|---|
| Open | Rossi Eugene | $200,000 | |
| Previous Owner | Rossi Eugene P | $150,000 |
Source: Public Records
Tax History Compared to Growth
Tax History
| Year | Tax Paid | Tax Assessment Tax Assessment Total Assessment is a certain percentage of the fair market value that is determined by local assessors to be the total taxable value of land and additions on the property. | Land | Improvement |
|---|---|---|---|---|
| 2025 | $6,290 | $583,838 | $140,727 | $443,111 |
| 2023 | $6,290 | $561,168 | $135,263 | $425,905 |
| 2022 | $6,085 | $550,165 | $132,611 | $417,554 |
| 2021 | $6,018 | $539,378 | $130,011 | $409,367 |
| 2020 | $6,009 | $533,848 | $128,678 | $405,170 |
| 2019 | $5,926 | $523,381 | $126,155 | $397,226 |
| 2018 | $5,773 | $513,120 | $123,682 | $389,438 |
| 2017 | $5,778 | $503,059 | $121,257 | $381,802 |
| 2016 | $5,613 | $493,196 | $118,880 | $374,316 |
| 2015 | $5,543 | $485,789 | $117,095 | $368,694 |
| 2014 | $5,444 | $476,274 | $114,802 | $361,472 |
Source: Public Records
Map
Nearby Homes
- 3563 Creekwood Dr
- 3425 Cimmeron Ct
- 3962 Rawhide Rd
- 3120 Aaron Dr
- 5247 Silver Peak Ln
- 3203 Thistle Ct
- 0 Skyline Dr Unit 225004715
- 4050 Whitney Vista Ln
- 4057 Whitney Vista Ln
- 4270 Midas Ave
- 3710 Clover Valley Rd
- 4072 Whitney Vista Ln
- 4150 Tahoe Vista Dr
- 3993 Aitken Dairy Rd
- 4346 Lakebreeze Dr
- 4834 Blaydon Rd
- 3204 Camelot Dr
- 2511 Sasparilla Ct
- 5406 Butte Cir
- 3724 Sweetwater Dr
- 2915 Dry Gulch Ct
- 3998 Rawhide Rd
- 3994 Rawhide Rd
- 4004 Rawhide Rd
- 2910 Dry Gulch Ct
- 2925 Dry Gulch Ct
- 4008 Rawhide Rd
- 3982 Rawhide Rd
- 4012 Rawhide Rd
- 4016 Rawhide Rd
- 2920 Dry Gulch Ct
- 3997 Rawhide Rd
- 3993 Rawhide Rd
- 3989 Rawhide Rd
- 4001 Rawhide Rd
- 2935 Dry Gulch Ct
- 4005 Rawhide Rd
- 3981 Rawhide Rd
- 4020 Rawhide Rd
- 3985 Rawhide Rd