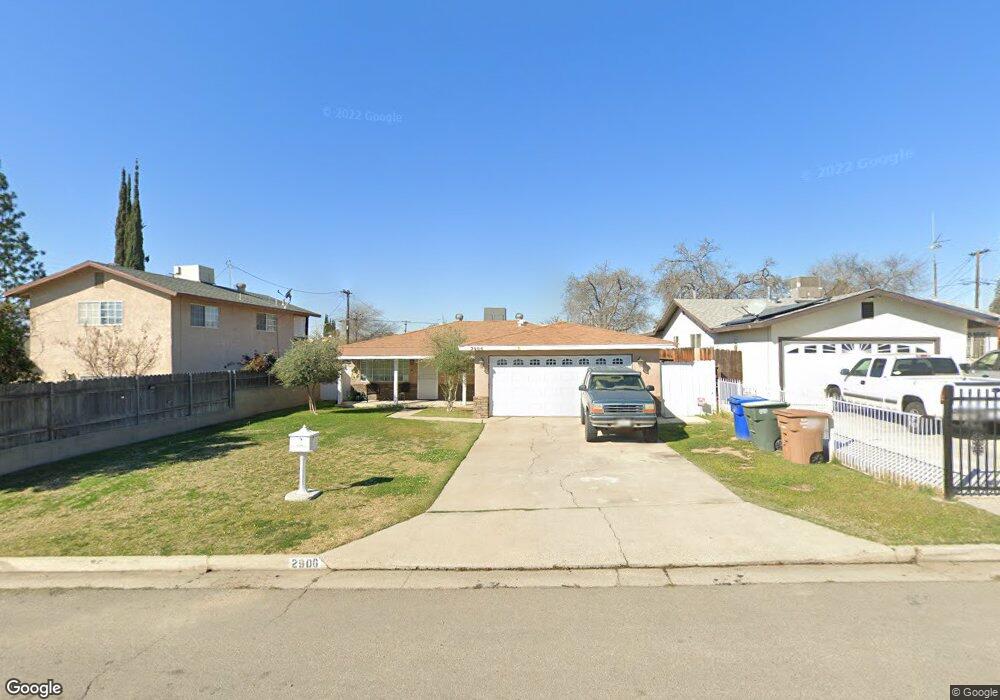
2906 Caliente St Bakersfield, CA 93306
Bakersfield Country Club NeighborhoodEstimated Value: $258,000 - $289,472
3
Beds
2
Baths
1,248
Sq Ft
$223/Sq Ft
Est. Value
About This Home
This home is located at 2906 Caliente St, Bakersfield, CA 93306 and is currently estimated at $277,868, approximately $222 per square foot. 2906 Caliente St is a home located in Kern County with nearby schools including Hort Elementary School, Walter Stiern Middle School, and East Bakersfield High School.
Ownership History
Date
Name
Owned For
Owner Type
Purchase Details
Closed on
Jun 20, 2017
Sold by
Bumgarner Michael S and The Bumgarner 401K Plan
Bought by
Vargas Otoniel
Current Estimated Value
Home Financials for this Owner
Home Financials are based on the most recent Mortgage that was taken out on this home.
Original Mortgage
$128,250
Outstanding Balance
$106,295
Interest Rate
3.89%
Mortgage Type
New Conventional
Estimated Equity
$171,573
Purchase Details
Closed on
May 15, 2017
Sold by
Georges Barbara and The Barbara Georges Living Tru
Bought by
Bumgarner Michael S and The Bumgarner 401K Plan
Home Financials for this Owner
Home Financials are based on the most recent Mortgage that was taken out on this home.
Original Mortgage
$128,250
Outstanding Balance
$106,295
Interest Rate
3.89%
Mortgage Type
New Conventional
Estimated Equity
$171,573
Purchase Details
Closed on
Jul 25, 2005
Sold by
Georges Barbara
Bought by
Georges S Barbara and Barbara Georges Living Trust
Create a Home Valuation Report for This Property
The Home Valuation Report is an in-depth analysis detailing your home's value as well as a comparison with similar homes in the area
Home Values in the Area
Average Home Value in this Area
Purchase History
| Date | Buyer | Sale Price | Title Company |
|---|---|---|---|
| Vargas Otoniel | $135,000 | Ticor Title Company | |
| Bumgarner Michael S | $75,000 | Ticor Title Company | |
| Georges S Barbara | -- | -- |
Source: Public Records
Mortgage History
| Date | Status | Borrower | Loan Amount |
|---|---|---|---|
| Open | Vargas Otoniel | $128,250 |
Source: Public Records
Tax History Compared to Growth
Tax History
| Year | Tax Paid | Tax Assessment Tax Assessment Total Assessment is a certain percentage of the fair market value that is determined by local assessors to be the total taxable value of land and additions on the property. | Land | Improvement |
|---|---|---|---|---|
| 2025 | $2,552 | $153,601 | $45,510 | $108,091 |
| 2024 | $2,489 | $150,590 | $44,618 | $105,972 |
| 2023 | $2,489 | $147,639 | $43,744 | $103,895 |
| 2022 | $2,402 | $144,745 | $42,887 | $101,858 |
| 2021 | $2,304 | $141,908 | $42,047 | $99,861 |
| 2020 | $2,254 | $140,454 | $41,616 | $98,838 |
| 2019 | $2,211 | $140,454 | $41,616 | $98,838 |
| 2018 | $2,144 | $135,000 | $40,000 | $95,000 |
| 2017 | $1,809 | $106,337 | $28,829 | $77,508 |
| 2016 | $1,672 | $104,253 | $28,264 | $75,989 |
| 2015 | $1,667 | $102,688 | $27,840 | $74,848 |
| 2014 | $1,622 | $100,677 | $27,295 | $73,382 |
Source: Public Records
Map
Nearby Homes
- 5132 Fernvale Rd
- 3017 Saratoga St
- 3112 Ridgedale St
- 3135 Oregon St
- 1323 El Serento Dr
- 1312 Tate St
- 3815 Mitchell Ave Unit A,B,C
- 1335 Oswell St
- 3819 Mitchell Ave
- 5008 College Ave
- 3826 Oregon St
- 2904 Glenwood Cir
- 5205 Lansdale Dr
- 1505 Glenwood Dr
- 2914 College Ave
- 3423 Monterey St
- 4010 Niles St
- 1800 Country Club Dr
- 3410 Culver St
- 2814 College Ave
- 2900 Caliente St
- 2908 Caliente St
- 5136 Fernvale Rd
- 5128 Fernvale Rd
- 3000 Caliente St
- 2901 Caliente St
- 5124 Fernvale Rd
- 2913 Caliente St
- 3004 Caliente St
- 3001 Caliente St
- 5120 Fernvale Rd
- 3005 Caliente St
- 2904 Ridgedale St
- 2908 Ridgedale St
- 3008 Caliente St
- 2900 Ridgedale St
- 3217 Hillburn Rd
- 5131 Fernvale Rd
- 0 Hillburn Rd
- 2912 Ridgedale St