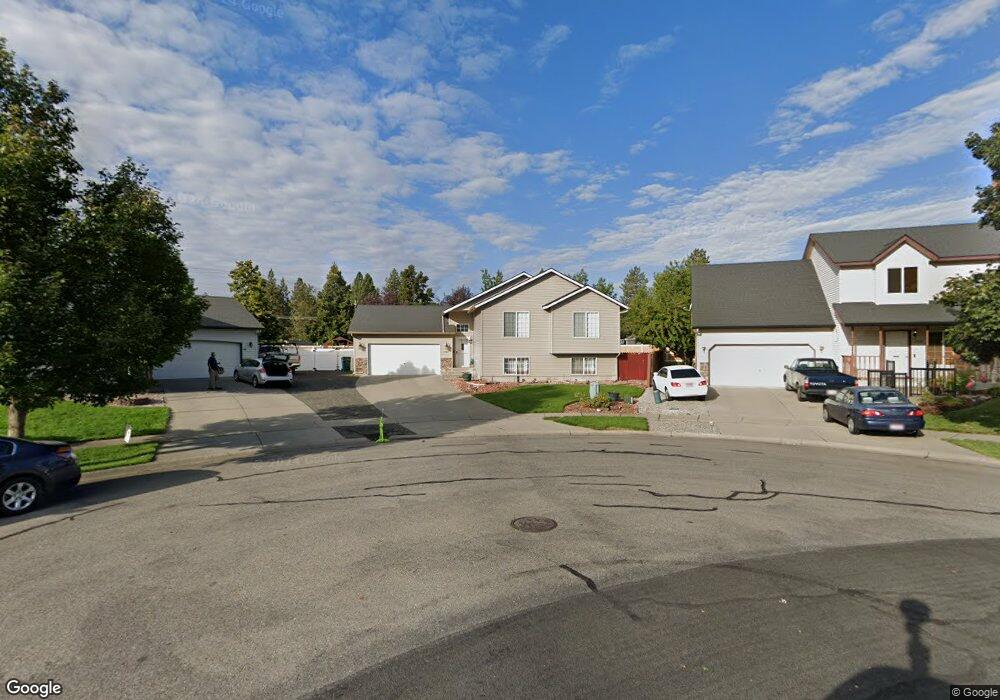
2906 N Alfalfa Loop Post Falls, ID 83854
North Prairie NeighborhoodEstimated Value: $504,259 - $557,000
4
Beds
3
Baths
2,253
Sq Ft
$239/Sq Ft
Est. Value
About This Home
This home is located at 2906 N Alfalfa Loop, Post Falls, ID 83854 and is currently estimated at $538,315, approximately $238 per square foot. 2906 N Alfalfa Loop is a home with nearby schools including Prairie View Elementary School, Post Falls Middle School, and Post Falls High School.
Ownership History
Date
Name
Owned For
Owner Type
Purchase Details
Closed on
Oct 25, 2017
Sold by
Mamuscia John F and Mamuscia Carol A
Bought by
Slck Commercial Properties Llc
Current Estimated Value
Home Financials for this Owner
Home Financials are based on the most recent Mortgage that was taken out on this home.
Original Mortgage
$195,200
Outstanding Balance
$161,685
Interest Rate
3.78%
Mortgage Type
New Conventional
Estimated Equity
$376,630
Purchase Details
Closed on
Jan 25, 2012
Sold by
Fannie Mae
Bought by
Schaub Cassandra and Schaub Matthew
Home Financials for this Owner
Home Financials are based on the most recent Mortgage that was taken out on this home.
Original Mortgage
$154,591
Interest Rate
3.88%
Mortgage Type
New Conventional
Purchase Details
Closed on
May 10, 2005
Sold by
Capell Dana L and Capell Jennifer A
Bought by
Hester J Hank
Home Financials for this Owner
Home Financials are based on the most recent Mortgage that was taken out on this home.
Original Mortgage
$156,000
Interest Rate
6.02%
Mortgage Type
New Conventional
Create a Home Valuation Report for This Property
The Home Valuation Report is an in-depth analysis detailing your home's value as well as a comparison with similar homes in the area
Home Values in the Area
Average Home Value in this Area
Purchase History
| Date | Buyer | Sale Price | Title Company |
|---|---|---|---|
| Slck Commercial Properties Llc | -- | Alliance Title & Escrow Corp | |
| Schaub Cassandra | -- | North Idaho Title Co | |
| Hester J Hank | -- | -- |
Source: Public Records
Mortgage History
| Date | Status | Borrower | Loan Amount |
|---|---|---|---|
| Open | Slck Commercial Properties Llc | $195,200 | |
| Previous Owner | Schaub Cassandra | $154,591 | |
| Previous Owner | Hester J Hank | $156,000 |
Source: Public Records
Tax History
| Year | Tax Paid | Tax Assessment Tax Assessment Total Assessment is a certain percentage of the fair market value that is determined by local assessors to be the total taxable value of land and additions on the property. | Land | Improvement |
|---|---|---|---|---|
| 2025 | $1,867 | $471,140 | $175,000 | $296,140 |
| 2024 | $2,011 | $486,780 | $152,000 | $334,780 |
| 2023 | $2,011 | $521,562 | $160,000 | $361,562 |
| 2022 | $2,676 | $559,236 | $157,500 | $401,736 |
| 2021 | $2,323 | $353,390 | $105,000 | $248,390 |
| 2020 | $2,404 | $309,710 | $90,000 | $219,710 |
| 2019 | $2,117 | $265,810 | $90,000 | $175,810 |
| 2018 | $1,847 | $230,330 | $70,000 | $160,330 |
| 2017 | $1,683 | $208,340 | $50,000 | $158,340 |
| 2016 | $1,569 | $189,980 | $40,000 | $149,980 |
| 2015 | $1,632 | $187,350 | $37,000 | $150,350 |
| 2013 | $1,458 | $160,680 | $32,000 | $128,680 |
Source: Public Records
Map
Nearby Homes
- 2489 N Side Saddle Ln
- 2533 N Side Saddle Ln
- 2744 N Alfalfa Loop
- 2325 N Mackenzie Dr
- 910 E Shasta Ave
- 561 E Sand Wedge Dr
- 2103 N Mackenzie Dr
- 2815 N Sand Trap Way
- 2770 N Slice
- 2435 N Bunchgrass Dr
- 2110 N Triumph Ct
- 906 E Glacier Peak Dr
- 2441 N Henry St
- 2430 N Titleist Way
- 1700 N Summer Hills Ct
- 908 E Allenby Ct
- 1207 E Horsehaven Ave
- 984 E Allenby Ave
- 880 E Allenby Ct
- 1074 E Allenby Ave
- 2914 N Alfalfa Loop
- 2900 N Alfalfa Loop
- 2932 N Alfalfa Loop
- 2892 N Alfalfa Loop
- 2952 N Alfalfa Loop
- 2874 N Alfalfa Loop
- 2929 N Alfalfa Loop
- 2970 N Alfalfa Loop
- 803 E Shasta Ave
- 2965 N Alfalfa Loop
- 2838 N Alfalfa Loop
- 807 E Shasta Ave
- 2511 N Side Saddle Ln
- 2990 N Alfalfa Loop
- 2499 N Ivy Ln
- 809 E Shasta Ave
- 2983 N Alfalfa Loop
- 2517 N Ivy Ln
- 2818 N Alfalfa Loop
- 2519 N Side Saddle Ln
Your Personal Tour Guide
Ask me questions while you tour the home.