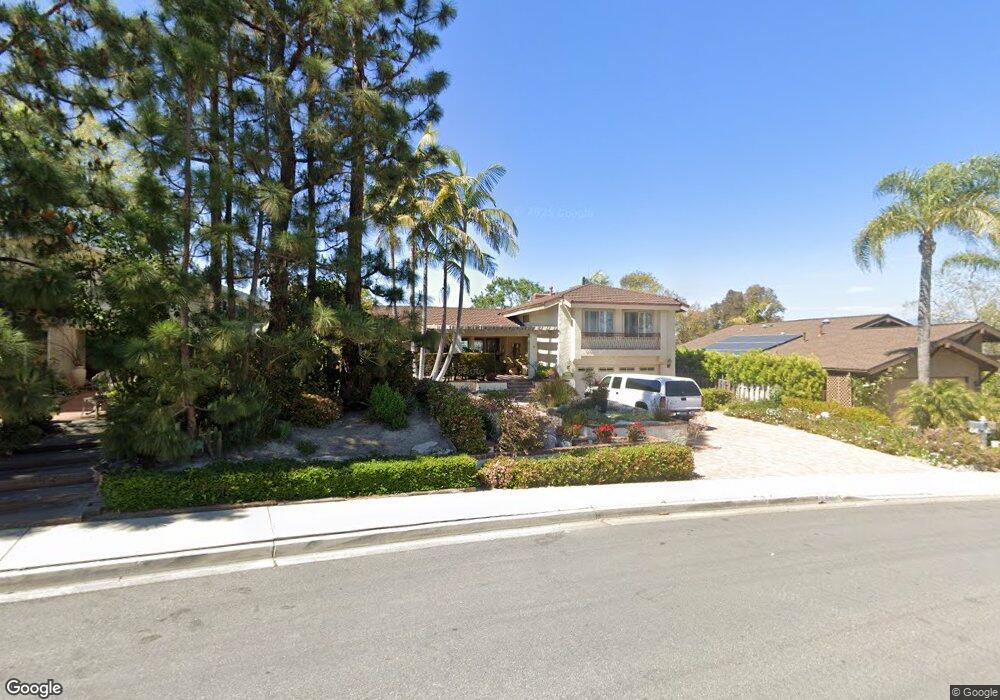
29061 Ridgeview Dr Laguna Niguel, CA 92677
Crown Valley Highlands NeighborhoodEstimated Value: $1,670,448 - $1,979,000
4
Beds
3
Baths
2,184
Sq Ft
$834/Sq Ft
Est. Value
About This Home
This home is located at 29061 Ridgeview Dr, Laguna Niguel, CA 92677 and is currently estimated at $1,822,362, approximately $834 per square foot. 29061 Ridgeview Dr is a home located in Orange County with nearby schools including Moulton Elementary, Aliso Viejo Middle School, and Aliso Niguel High School.
Ownership History
Date
Name
Owned For
Owner Type
Purchase Details
Closed on
Aug 2, 1993
Sold by
Lepak John R and Lepak Julia C
Bought by
Lepak John R and Lepak Julia C
Current Estimated Value
Create a Home Valuation Report for This Property
The Home Valuation Report is an in-depth analysis detailing your home's value as well as a comparison with similar homes in the area
Home Values in the Area
Average Home Value in this Area
Purchase History
| Date | Buyer | Sale Price | Title Company |
|---|---|---|---|
| Lepak John R | -- | -- |
Source: Public Records
Tax History Compared to Growth
Tax History
| Year | Tax Paid | Tax Assessment Tax Assessment Total Assessment is a certain percentage of the fair market value that is determined by local assessors to be the total taxable value of land and additions on the property. | Land | Improvement |
|---|---|---|---|---|
| 2025 | $2,588 | $266,006 | $92,411 | $173,595 |
| 2024 | $2,588 | $260,791 | $90,599 | $170,192 |
| 2023 | $2,532 | $255,678 | $88,823 | $166,855 |
| 2022 | $2,482 | $250,665 | $87,081 | $163,584 |
| 2021 | $2,433 | $245,750 | $85,373 | $160,377 |
| 2020 | $2,408 | $243,231 | $84,498 | $158,733 |
| 2019 | $2,360 | $238,462 | $82,841 | $155,621 |
| 2018 | $2,313 | $233,787 | $81,217 | $152,570 |
| 2017 | $2,266 | $229,203 | $79,624 | $149,579 |
| 2016 | $2,222 | $224,709 | $78,062 | $146,647 |
| 2015 | $2,187 | $221,334 | $76,889 | $144,445 |
| 2014 | $2,143 | $216,999 | $75,383 | $141,616 |
Source: Public Records
Map
Nearby Homes
- 28891 Drakes Bay
- 29254 Alfieri St
- 29312 Kensington Dr
- 29372 Christiana Way Unit 51
- 28661 Point Loma
- 29452 Port Royal Way
- 29494 Port Royal Way
- 7 Sierra Vista
- 29522 Seriana
- 4 Palatine
- 28 Florentine Unit 1
- 29712 Ellendale Dr
- 29632 Seriana
- 29141 Bobolink Dr
- 23231 Cheswald Dr
- 199 Las Flores
- 23653 Lexington Ct Unit 2
- 23706 Sea Breeze Ln Unit 1
- 29931 Happy Sparrow Ln
- 29981 Running Deer Ln
- 29065 Ridgeview Dr
- 29055 Ridgeview Dr
- 29071 Ridgeview Dr
- 29062 Ridgeview Dr
- 29056 Ridgeview Dr
- 29075 Ridgeview Dr
- 29045 Ridgeview Dr
- 29081 Ridgeview Dr
- 29042 Ridgeview Dr
- 29082 Ridgeview Dr
- 29072 Kensington Dr
- 29041 Ridgeview Dr
- 29091 Ridgeview Dr
- 29072 Ridgeview Dr
- 29036 Ridgeview Dr
- 29035 Ridgeview Dr
- 29112 Ridgeview Dr
- 29102 Ridgeview Dr
- 29101 Ridgeview Dr
- 29032 Ridgeview Dr