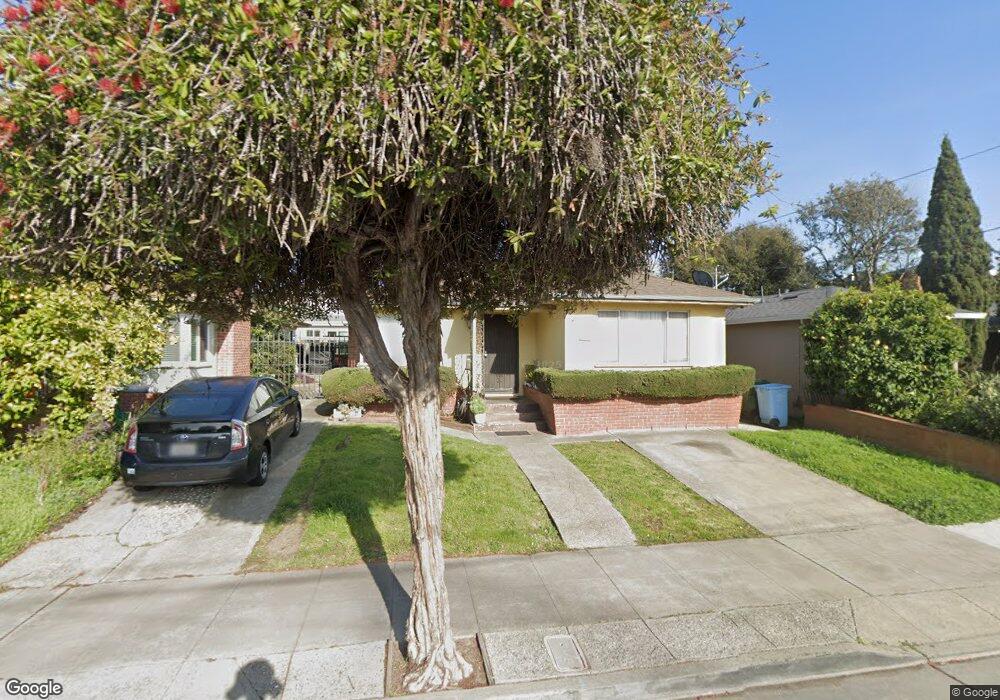
2907 Dohr St Berkeley, CA 94702
West Berkeley NeighborhoodEstimated Value: $1,009,281 - $1,176,000
3
Beds
1
Bath
1,322
Sq Ft
$827/Sq Ft
Est. Value
About This Home
This home is located at 2907 Dohr St, Berkeley, CA 94702 and is currently estimated at $1,093,570, approximately $827 per square foot. 2907 Dohr St is a home located in Alameda County with nearby schools including Malcolm X Elementary School, Washington Elementary School, and Oxford Elementary School.
Ownership History
Date
Name
Owned For
Owner Type
Purchase Details
Closed on
Feb 17, 2011
Sold by
Munson Mattie G
Bought by
Simmons Sherri
Current Estimated Value
Create a Home Valuation Report for This Property
The Home Valuation Report is an in-depth analysis detailing your home's value as well as a comparison with similar homes in the area
Home Values in the Area
Average Home Value in this Area
Purchase History
| Date | Buyer | Sale Price | Title Company |
|---|---|---|---|
| Simmons Sherri | -- | None Available |
Source: Public Records
Tax History
| Year | Tax Paid | Tax Assessment Tax Assessment Total Assessment is a certain percentage of the fair market value that is determined by local assessors to be the total taxable value of land and additions on the property. | Land | Improvement |
|---|---|---|---|---|
| 2025 | $3,799 | $56,880 | $21,330 | $35,550 |
| 2024 | $3,799 | $55,765 | $20,912 | $34,853 |
| 2023 | $3,638 | $54,672 | $20,502 | $34,170 |
| 2022 | $3,458 | $53,600 | $20,100 | $33,500 |
| 2021 | $3,428 | $52,549 | $19,706 | $32,843 |
| 2020 | $3,383 | $52,011 | $19,504 | $32,507 |
| 2019 | $2,919 | $50,990 | $19,121 | $31,869 |
| 2018 | $9,523 | $595,237 | $178,571 | $416,666 |
| 2017 | $9,181 | $583,565 | $175,069 | $408,496 |
| 2016 | $8,890 | $572,125 | $171,637 | $400,488 |
| 2015 | $8,766 | $563,534 | $169,060 | $394,474 |
| 2014 | $8,697 | $552,496 | $165,749 | $386,747 |
Source: Public Records
Map
Nearby Homes
- 2922 Stanton St
- 1314 Ashby Ave
- 1535 Julia St
- 2790 Sacramento St
- 2782 Sacramento St
- 1507 Prince St
- 2774 Sacramento St
- 1530 Stuart St
- 2758 Sacramento St
- 1450 Ward St
- 3101 Sacramento St
- 2750 Sacramento St
- 3032 Mabel St
- 1237 Ashby Ave
- 3110 California St
- 3114 California St
- 1646 Ashby Ave
- 2751 Wallace St
- 1515 Derby St
- 3138 California St
- 2905 Dohr St
- 2909 Dohr St
- 1404 Russell St
- 1408 Russell St
- 2918 Stanton Ave Unit C
- 2915 Dohr St
- 1412 Russell St
- 2920 Stanton St
- 2913 Acton St
- 2909 Acton St
- 1416 Russell St
- 2915 Acton St
- 2925 Dohr St Unit B
- 2925 Dohr St Unit A
- 2905 Acton St
- 2919 Acton St
- 0 Dohr St
- 2922 Dohr St
- 2901 Acton St
- 2926 Stanton St
Your Personal Tour Guide
Ask me questions while you tour the home.