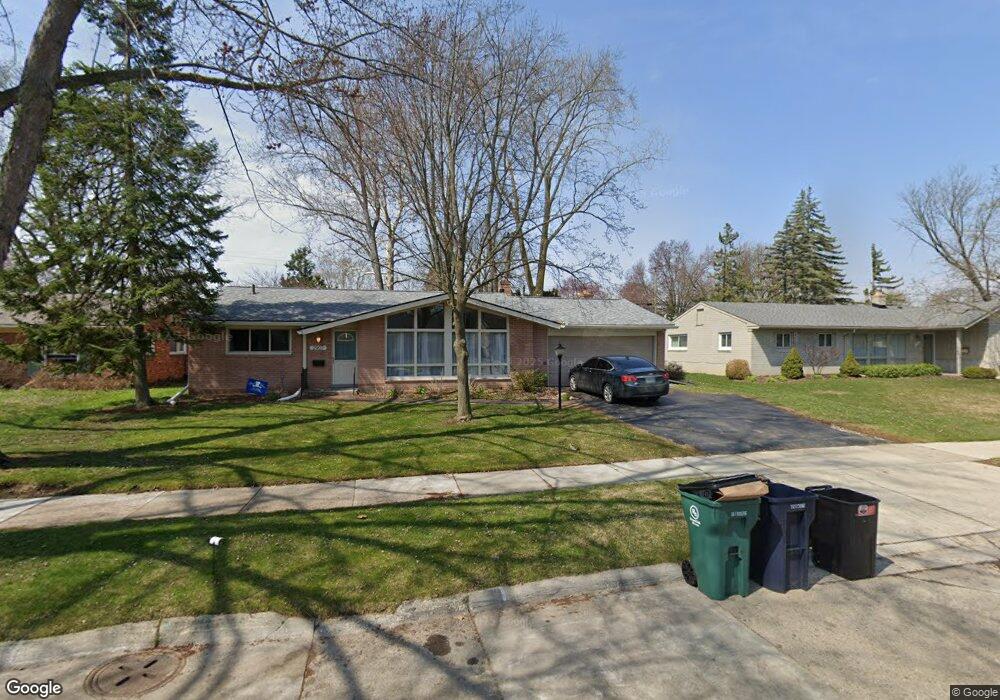
2907 Linwood Ave Royal Oak, MI 48073
Estimated Value: $357,000 - $454,000
3
Beds
2
Baths
1,300
Sq Ft
$304/Sq Ft
Est. Value
About This Home
This home is located at 2907 Linwood Ave, Royal Oak, MI 48073 and is currently estimated at $395,182, approximately $303 per square foot. 2907 Linwood Ave is a home located in Oakland County with nearby schools including Addams Elementary, Royal Oak Middle School, and Royal Oak High School.
Ownership History
Date
Name
Owned For
Owner Type
Purchase Details
Closed on
Dec 14, 2012
Sold by
Peters Patrick R
Bought by
Cpp Securitas Llc
Current Estimated Value
Home Financials for this Owner
Home Financials are based on the most recent Mortgage that was taken out on this home.
Original Mortgage
$101,500
Interest Rate
3.35%
Mortgage Type
New Conventional
Purchase Details
Closed on
Nov 16, 2012
Sold by
Peters Patrick R
Bought by
Peters Patrick R and Peters Deborah J
Home Financials for this Owner
Home Financials are based on the most recent Mortgage that was taken out on this home.
Original Mortgage
$101,500
Interest Rate
3.35%
Mortgage Type
New Conventional
Purchase Details
Closed on
May 30, 2008
Sold by
Peters Patrick
Bought by
Cpp Securitas Llc
Purchase Details
Closed on
May 16, 2008
Sold by
Revocable Living Tr Of Kathleen Henkel and Stewart Helen
Bought by
Peter Patrick R and Peters Deborah J
Create a Home Valuation Report for This Property
The Home Valuation Report is an in-depth analysis detailing your home's value as well as a comparison with similar homes in the area
Home Values in the Area
Average Home Value in this Area
Purchase History
| Date | Buyer | Sale Price | Title Company |
|---|---|---|---|
| Cpp Securitas Llc | -- | None Available | |
| Peters Patrick R | -- | None Available | |
| Peters Patrick R | -- | First Title & Escrow | |
| Peters Patrick R | -- | First Title & Escrow | |
| Cpp Securitas Llc | -- | None Available | |
| Peters Patrick | -- | None Available | |
| Peter Patrick R | $140,000 | Title One Inc |
Source: Public Records
Mortgage History
| Date | Status | Borrower | Loan Amount |
|---|---|---|---|
| Previous Owner | Peters Patrick R | $101,500 |
Source: Public Records
Tax History Compared to Growth
Tax History
| Year | Tax Paid | Tax Assessment Tax Assessment Total Assessment is a certain percentage of the fair market value that is determined by local assessors to be the total taxable value of land and additions on the property. | Land | Improvement |
|---|---|---|---|---|
| 2024 | $5,275 | $145,740 | $0 | $0 |
| 2022 | $5,753 | $131,980 | $0 | $0 |
| 2020 | $5,088 | $119,640 | $0 | $0 |
| 2018 | $5,753 | $110,150 | $0 | $0 |
| 2017 | $5,224 | $110,150 | $0 | $0 |
| 2015 | -- | $99,830 | $0 | $0 |
| 2014 | -- | $93,360 | $0 | $0 |
| 2011 | -- | $87,800 | $0 | $0 |
Source: Public Records
Map
Nearby Homes
- 2916 Clawson Ave
- 3025 Clawson Ave
- 3100 Linwood Ave Unit B, 28
- 2925 Benjamin Ave
- 2804 Shenandoah Dr
- 2606 Benjamin Ave
- 2806 Shenandoah Dr
- 3122 Benjamin Ave
- 2602 Trafford Rd
- 2614 Essex St
- 2714 Glenview Ave
- 3402 Woodland Ave
- 2503 W 13 Mile Rd Unit 18
- 2403 Clawson Ave
- 3415 Benjamin Ave Unit 505
- 3439 Benjamin Ave Unit 121
- 2834 Bamlet Rd
- 3532 Woodland Ave
- 2814 Crooks Rd
- 2422 Oliver Rd
- 2825 Linwood Ave
- 2915 Linwood Ave
- 2906 Elmhurst Ave
- 2902 Elmhurst Ave
- 2912 Elmhurst Ave
- 2815 Linwood Ave
- 2923 Linwood Ave
- 2822 Elmhurst Ave
- 2916 Elmhurst Ave
- 2908 Linwood Ave
- 2912 Linwood Ave
- 2818 Elmhurst Ave
- 2824 Linwood Ave
- 2916 Linwood Ave
- 2922 Elmhurst Ave
- 2816 Linwood Ave Unit Bldg-Unit
- 2816 Linwood Ave
- 2929 Linwood Ave
- 2807 Linwood Ave
- 2810 Elmhurst Ave