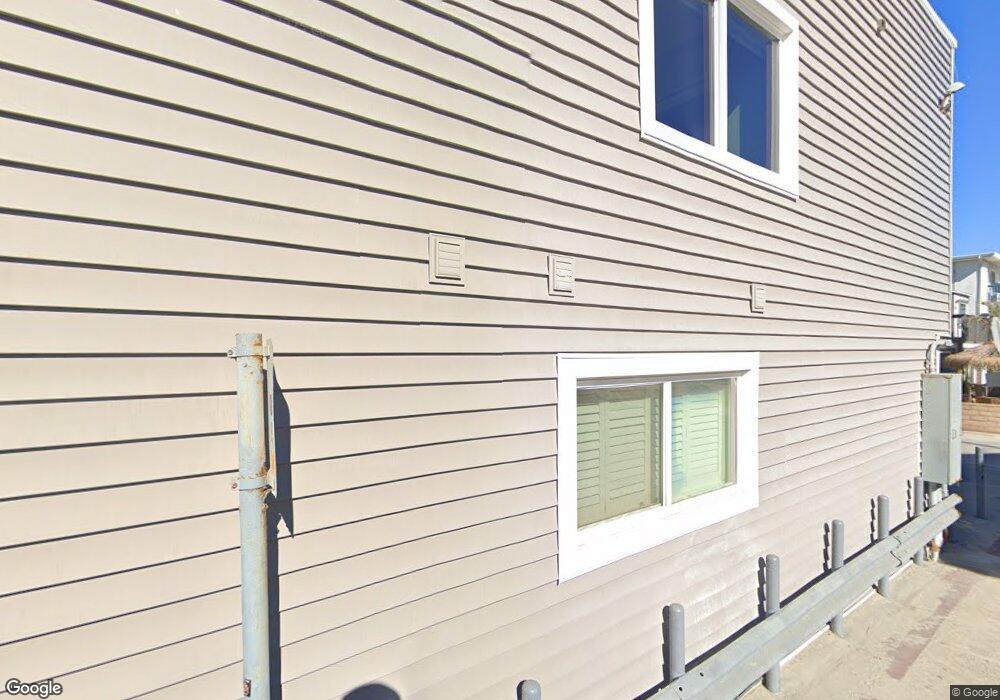
2907 Ocean Front Walk San Diego, CA 92109
Mission Beach NeighborhoodEstimated Value: $2,138,000 - $2,784,000
3
Beds
3
Baths
2,444
Sq Ft
$1,000/Sq Ft
Est. Value
About This Home
This home is located at 2907 Ocean Front Walk, San Diego, CA 92109 and is currently estimated at $2,444,113, approximately $1,000 per square foot. 2907 Ocean Front Walk is a home located in San Diego County with nearby schools including Pacific Beach Elementary School, Pacific Beach Middle, and Mission Bay High School.
Ownership History
Date
Name
Owned For
Owner Type
Purchase Details
Closed on
Mar 13, 2024
Sold by
William P Reilly Jr Family Trust and Reilly William P
Bought by
William P Reilly Jr Survivors Trust and Reilly
Current Estimated Value
Purchase Details
Closed on
Dec 4, 2007
Sold by
Corpstein Barbara J
Bought by
Corpstein John R
Purchase Details
Closed on
Dec 3, 2007
Sold by
Corpstein W H and Corpstein Sue Ann
Bought by
Reilly William P
Purchase Details
Closed on
Nov 29, 2007
Sold by
Corpstein W H and Corpstein Sue Ann
Bought by
Skiles Michael L and Skiles Treasa L
Purchase Details
Closed on
Dec 3, 2003
Sold by
Corpstein Alice
Bought by
Corpstein Peter J
Purchase Details
Closed on
Sep 27, 2002
Sold by
Anderson Robert M and Anderson Lyn
Bought by
Reilly William P
Create a Home Valuation Report for This Property
The Home Valuation Report is an in-depth analysis detailing your home's value as well as a comparison with similar homes in the area
Home Values in the Area
Average Home Value in this Area
Purchase History
| Date | Buyer | Sale Price | Title Company |
|---|---|---|---|
| William P Reilly Jr Survivors Trust | -- | None Listed On Document | |
| Corpstein John R | -- | First American Title Company | |
| Reilly William P | -- | First American Title Company | |
| Corpstein W H | -- | First American Title Company | |
| Corpstein W H | -- | First American Title Company | |
| Skiles Michael L | -- | First American Title Company | |
| Corpstein Peter J | -- | First American Title Company | |
| Reilly William P | $750,000 | Chicago Title Co |
Source: Public Records
Tax History Compared to Growth
Tax History
| Year | Tax Paid | Tax Assessment Tax Assessment Total Assessment is a certain percentage of the fair market value that is determined by local assessors to be the total taxable value of land and additions on the property. | Land | Improvement |
|---|---|---|---|---|
| 2025 | $9,462 | $782,277 | $456,727 | $325,550 |
| 2024 | $9,462 | $766,939 | $447,772 | $319,167 |
| 2023 | $9,253 | $751,902 | $438,993 | $312,909 |
| 2022 | $9,007 | $737,160 | $430,386 | $306,774 |
| 2021 | $8,944 | $722,707 | $421,948 | $300,759 |
| 2020 | $8,835 | $715,298 | $417,622 | $297,676 |
| 2019 | $8,678 | $701,274 | $409,434 | $291,840 |
| 2018 | $8,114 | $687,524 | $401,406 | $286,118 |
| 2017 | $80 | $674,044 | $393,536 | $280,508 |
| 2016 | $7,802 | $660,828 | $385,820 | $275,008 |
| 2015 | $7,687 | $650,903 | $380,025 | $270,878 |
| 2014 | $7,563 | $638,153 | $372,581 | $265,572 |
Source: Public Records
Map
Nearby Homes
- 2965 Mission Blvd Unit 4C
- 808 Ensenada Ct
- 2999 Mission Blvd Unit 201
- 2820 Bayside Walk Unit 2
- 2808 Bayside Walk Unit B
- 2740 Ocean Front Walk
- 2727 Ocean Front Walk Unit 3
- 2735 Mission Blvd
- 722 San Luis Rey Place Unit 24
- 817 San Luis Rey Place
- 801 Allerton Ct
- 2623 Ocean Front Walk
- 2617 Ocean Front Walk
- 2632 Bayside Walk
- 717 Island Ct
- 728 Jamaica Ct
- 3286-88 Bayside Walk
- 3291 Bayside Walk
- 810 Santa Barbara Place
- 735 Jersey Ct
- 2905 Ocean Front Walk
- 710 San Gabriel Place
- 2911 Ocean Front Walk
- 2909 Ocean Front Walk
- 2889 Ocean Front Walk
- 716 San Gabriel Place
- 2915 Ocean Front Walk
- 2913 Ocean Front Walk
- 714 San Gabriel Place
- 718 San Gabriel Place Unit 20
- 711 San Gabriel Place Unit 1
- 715 San Gabriel Place Unit 2
- 2887 Ocean Front Walk
- 2917 Ocean Front Walk
- 2919 Ocean Front Walk
- 717 San Gabriel Place Unit L1
- 2921 Ocean Front Walk
- 715 Devon Ct
- 719 San Gabriel Place Unit L2
- 728 San Gabriel Place