Estimated Value: $497,000 - $557,151
Studio
3
Baths
2,253
Sq Ft
$231/Sq Ft
Est. Value
About This Home
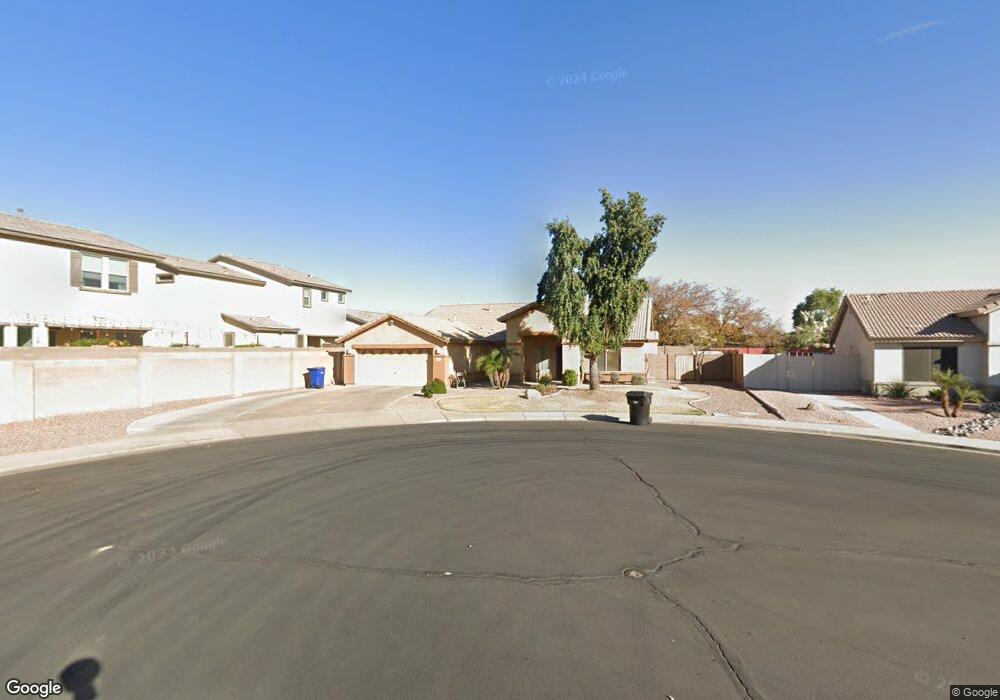
This home is located at 2907 S Lynch Cir, Mesa, AZ 85212 and is currently estimated at $521,038, approximately $231 per square foot. 2907 S Lynch Cir is a home located in Maricopa County with nearby schools including Boulder Creek Elementary School, Desert Ridge Jr. High School, and Desert Ridge High School.
Ownership History
Date
Name
Owned For
Owner Type
Purchase Details
Closed on
Dec 27, 2001
Sold by
Fetters Danny R
Bought by
Curtis Matthew
Current Estimated Value
Home Financials for this Owner
Home Financials are based on the most recent Mortgage that was taken out on this home.
Original Mortgage
$133,200
Outstanding Balance
$49,416
Interest Rate
5.75%
Mortgage Type
New Conventional
Estimated Equity
$471,622
Purchase Details
Closed on
Mar 2, 2001
Sold by
Fetters Donna Dee
Bought by
Fetters Danny R
Purchase Details
Closed on
Apr 25, 2000
Sold by
U S Development Inc
Bought by
Fetters Danny R and Deitermann Donna D
Home Financials for this Owner
Home Financials are based on the most recent Mortgage that was taken out on this home.
Original Mortgage
$165,217
Interest Rate
8.24%
Mortgage Type
Seller Take Back
Create a Home Valuation Report for This Property
The Home Valuation Report is an in-depth analysis detailing your home's value as well as a comparison with similar homes in the area
Purchase History
| Date | Buyer | Sale Price | Title Company |
|---|---|---|---|
| Curtis Matthew | $148,000 | First American Title | |
| Fetters Danny R | -- | First American Title | |
| Fetters Danny R | $173,913 | Transnation Title Insurance | |
| U S Development Inc | -- | Transnation Title Insurance |
Source: Public Records
Mortgage History
| Date | Status | Borrower | Loan Amount |
|---|---|---|---|
| Open | Curtis Matthew | $133,200 | |
| Previous Owner | Fetters Danny R | $165,217 |
Source: Public Records
Tax History
| Year | Tax Paid | Tax Assessment Tax Assessment Total Assessment is a certain percentage of the fair market value that is determined by local assessors to be the total taxable value of land and additions on the property. | Land | Improvement |
|---|---|---|---|---|
| 2025 | $1,916 | $25,869 | -- | -- |
| 2024 | $1,859 | $24,637 | -- | -- |
| 2023 | $1,859 | $42,080 | $8,410 | $33,670 |
| 2022 | $1,814 | $30,910 | $6,180 | $24,730 |
| 2021 | $1,965 | $29,130 | $5,820 | $23,310 |
| 2020 | $1,930 | $27,270 | $5,450 | $21,820 |
| 2019 | $1,789 | $25,170 | $5,030 | $20,140 |
| 2018 | $1,703 | $23,630 | $4,720 | $18,910 |
| 2017 | $1,650 | $22,130 | $4,420 | $17,710 |
| 2016 | $1,711 | $21,370 | $4,270 | $17,100 |
| 2015 | $1,569 | $20,950 | $4,190 | $16,760 |
Source: Public Records
Map
Nearby Homes
- 2741 S 85th Way
- 3066 S Shelby
- 8541 E Neville Ave
- 8640 E Naranja Ave
- 2731 S Eastridge
- 2705 S Zinnia
- 8348 E Nopal Ave
- 8761 E Obispo Ave
- 8254 E Posada Ave
- 8249 E Posada Ave
- 8458 E Nido Ave
- 8203 E Nopal Ave
- 8320 E Peterson Ave
- 8214 E Navarro Ave
- 3200 S Hawes Rd
- 8738 E Natal Cir
- 8312 E Petra Ave
- 3251 S Lotus
- 8304 E Petra Ave
- 8448 E Monte Cir Unit II
- 8517 E Osage Ave
- 2915 S Lynch Cir
- 8513 E Osage Ave
- 8523 E Osage Ave
- 8509 E Osage Ave
- 2908 S Joslyn
- 8527 E Osage Ave
- 2916 S Joslyn
- 8514 E Osage Ave
- 2923 S Lynch Cir Unit 1
- 8520 E Osage Ave
- 8533 E Osage Ave
- 2906 S Lynch Cir
- 8524 E Osage Ave
- 2914 S Lynch Cir
- 2852 S Lynch
- 8530 E Osage Ave
- 8534 E Onza Ave
- 2924 S Joslyn
- 8515 E Organza Ave
Your Personal Tour Guide
Ask me questions while you tour the home.