2907 Spreckels Ct Redondo Beach, CA 90278
North Redondo Beach NeighborhoodEstimated Value: $1,282,257 - $1,553,000
3
Beds
2
Baths
1,538
Sq Ft
$942/Sq Ft
Est. Value
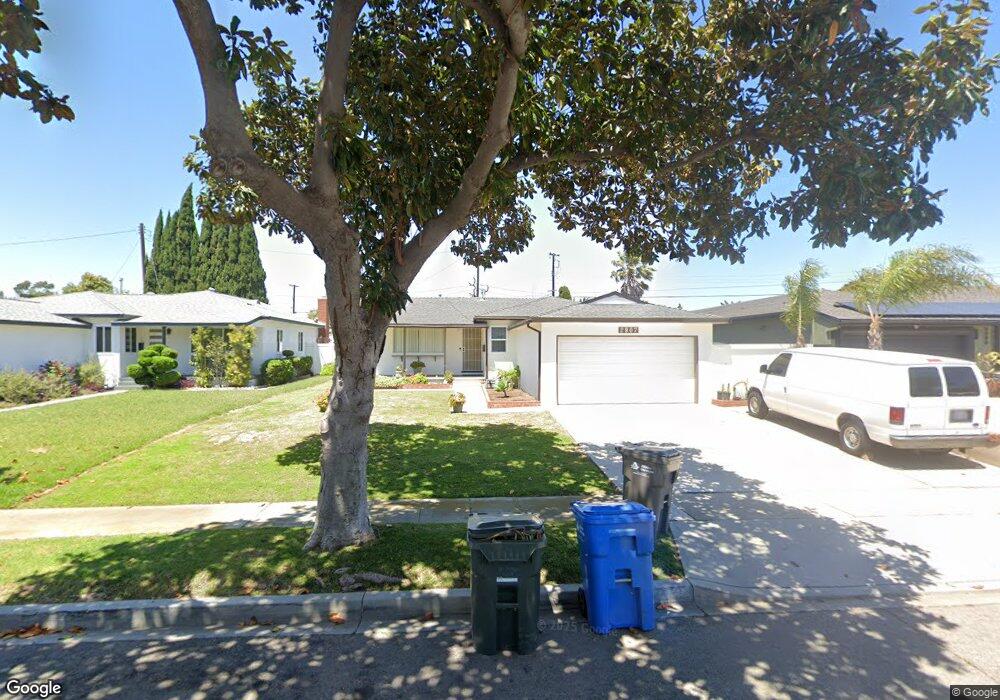
About This Home
This home is located at 2907 Spreckels Ct, Redondo Beach, CA 90278 and is currently estimated at $1,449,314, approximately $942 per square foot. 2907 Spreckels Ct is a home located in Los Angeles County with nearby schools including Washington Elementary School, Adams Middle School, and Redondo Union High School.
Ownership History
Date
Name
Owned For
Owner Type
Purchase Details
Closed on
Sep 3, 2002
Sold by
Greystone Homes Inc
Bought by
Tan Howard L and Chu Li Fan
Current Estimated Value
Home Financials for this Owner
Home Financials are based on the most recent Mortgage that was taken out on this home.
Original Mortgage
$388,000
Interest Rate
6.15%
Purchase Details
Closed on
Dec 14, 2001
Sold by
Olivera Cesar
Bought by
Fernandez Carlos and Fernandez Sonia
Purchase Details
Closed on
Mar 26, 2001
Sold by
Kinnon John
Bought by
Fernandez Carlos and Fernandez Sonia
Home Financials for this Owner
Home Financials are based on the most recent Mortgage that was taken out on this home.
Original Mortgage
$276,000
Interest Rate
6.92%
Mortgage Type
Stand Alone First
Purchase Details
Closed on
Dec 15, 1999
Sold by
Kinnon John
Bought by
Kinnon John and Kinnon Maureen
Create a Home Valuation Report for This Property
The Home Valuation Report is an in-depth analysis detailing your home's value as well as a comparison with similar homes in the area
Home Values in the Area
Average Home Value in this Area
Purchase History
| Date | Buyer | Sale Price | Title Company |
|---|---|---|---|
| Tan Howard L | $485,500 | North American Title Co | |
| Fernandez Carlos | -- | -- | |
| Fernandez Carlos | $345,000 | South Coast Title Company | |
| Kinnon John | -- | -- |
Source: Public Records
Mortgage History
| Date | Status | Borrower | Loan Amount |
|---|---|---|---|
| Previous Owner | Tan Howard L | $388,000 | |
| Previous Owner | Fernandez Carlos | $276,000 |
Source: Public Records
Tax History Compared to Growth
Tax History
| Year | Tax Paid | Tax Assessment Tax Assessment Total Assessment is a certain percentage of the fair market value that is determined by local assessors to be the total taxable value of land and additions on the property. | Land | Improvement |
|---|---|---|---|---|
| 2025 | $6,973 | $557,001 | $459,211 | $97,790 |
| 2024 | $6,973 | $546,080 | $450,207 | $95,873 |
| 2023 | $6,852 | $535,374 | $441,380 | $93,994 |
| 2022 | $6,719 | $524,877 | $432,726 | $92,151 |
| 2021 | $6,536 | $514,587 | $424,242 | $90,345 |
| 2019 | $6,369 | $499,325 | $411,659 | $87,666 |
| 2018 | $6,139 | $489,536 | $403,588 | $85,948 |
| 2016 | $5,935 | $470,528 | $387,917 | $82,611 |
| 2015 | $5,831 | $463,462 | $382,091 | $81,371 |
| 2014 | $5,750 | $454,385 | $374,607 | $79,778 |
Source: Public Records
Map
Nearby Homes
- 2905 Spreckels Ct
- 18413 Burin Ave
- 18406 Kingsdale Ave
- 18204 Kingsdale Ave
- 2708 184th St
- 2617 Alvord Ln
- 2708 183rd St
- 1300 Firmona Ave
- 4325 W 182nd St Unit 18
- 2519 Ralston Ln
- 2617 182nd St
- 2507 185th St
- 4101 W 184th St
- 907 Lilienthal Ln
- 2420 Ives Ln Unit B
- 2420 Ives Ln Unit A
- 3960 W 187th St
- 20034 Grevillea Ave
- 19219 Beckworth Ave
- 20017 Bernist Ave
- 2909 Spreckels Ct
- 2827 Fisk Ln
- 2829 Fisk Ln
- 2825 Fisk Ln
- 2904 Spreckels Ct
- 2906 Spreckels Ct
- 2902 Spreckels Ct
- 2900 Spreckels Ct
- 2908 Spreckels Ct
- 2823 Fisk Ln
- 2900 Fisk Ln
- 2910 Spreckels Ct
- 2902 Fisk Ln
- 2912 Spreckels Ct
- 2817 Spreckels Ln
- 2821 Fisk Ln
- 2904 Fisk Ln
- 2906 Fisk Ln
- 2819 Fisk Ln
- 2816 Fisk Ln